20+ Years of Advancing Data Visualization: Interview with Our CEO
February 5th, 2025 by AnyChart Team Unicorns Journal just published an interview with our CEO and co-founder, Anton Baranchuk, where he reflects on AnyChart’s journey from a small startup to a global leader in data visualization, trusted by enterprises worldwide.
Anton talks about how we got started, the transition from Flash to JavaScript charting, our work with Qlik, and the vision and values that continue to drive us forward.
- Categories: AnyChart Charting Component, AnyGantt, AnyMap, AnyStock, Big Data, Blogroll, Books, Business Intelligence, Dashboards, Financial Charts, Flash Platform, Gantt Chart, GraphicsJS, HTML5, JavaScript, News, Oracle Apex, Qlik, Stock Charts, Success Stories
- No Comments »
Austrian Academy of Sciences (ÖAW) Uses AnyChart JS for Literary Data Visualization
September 17th, 2024 by AnyChart Team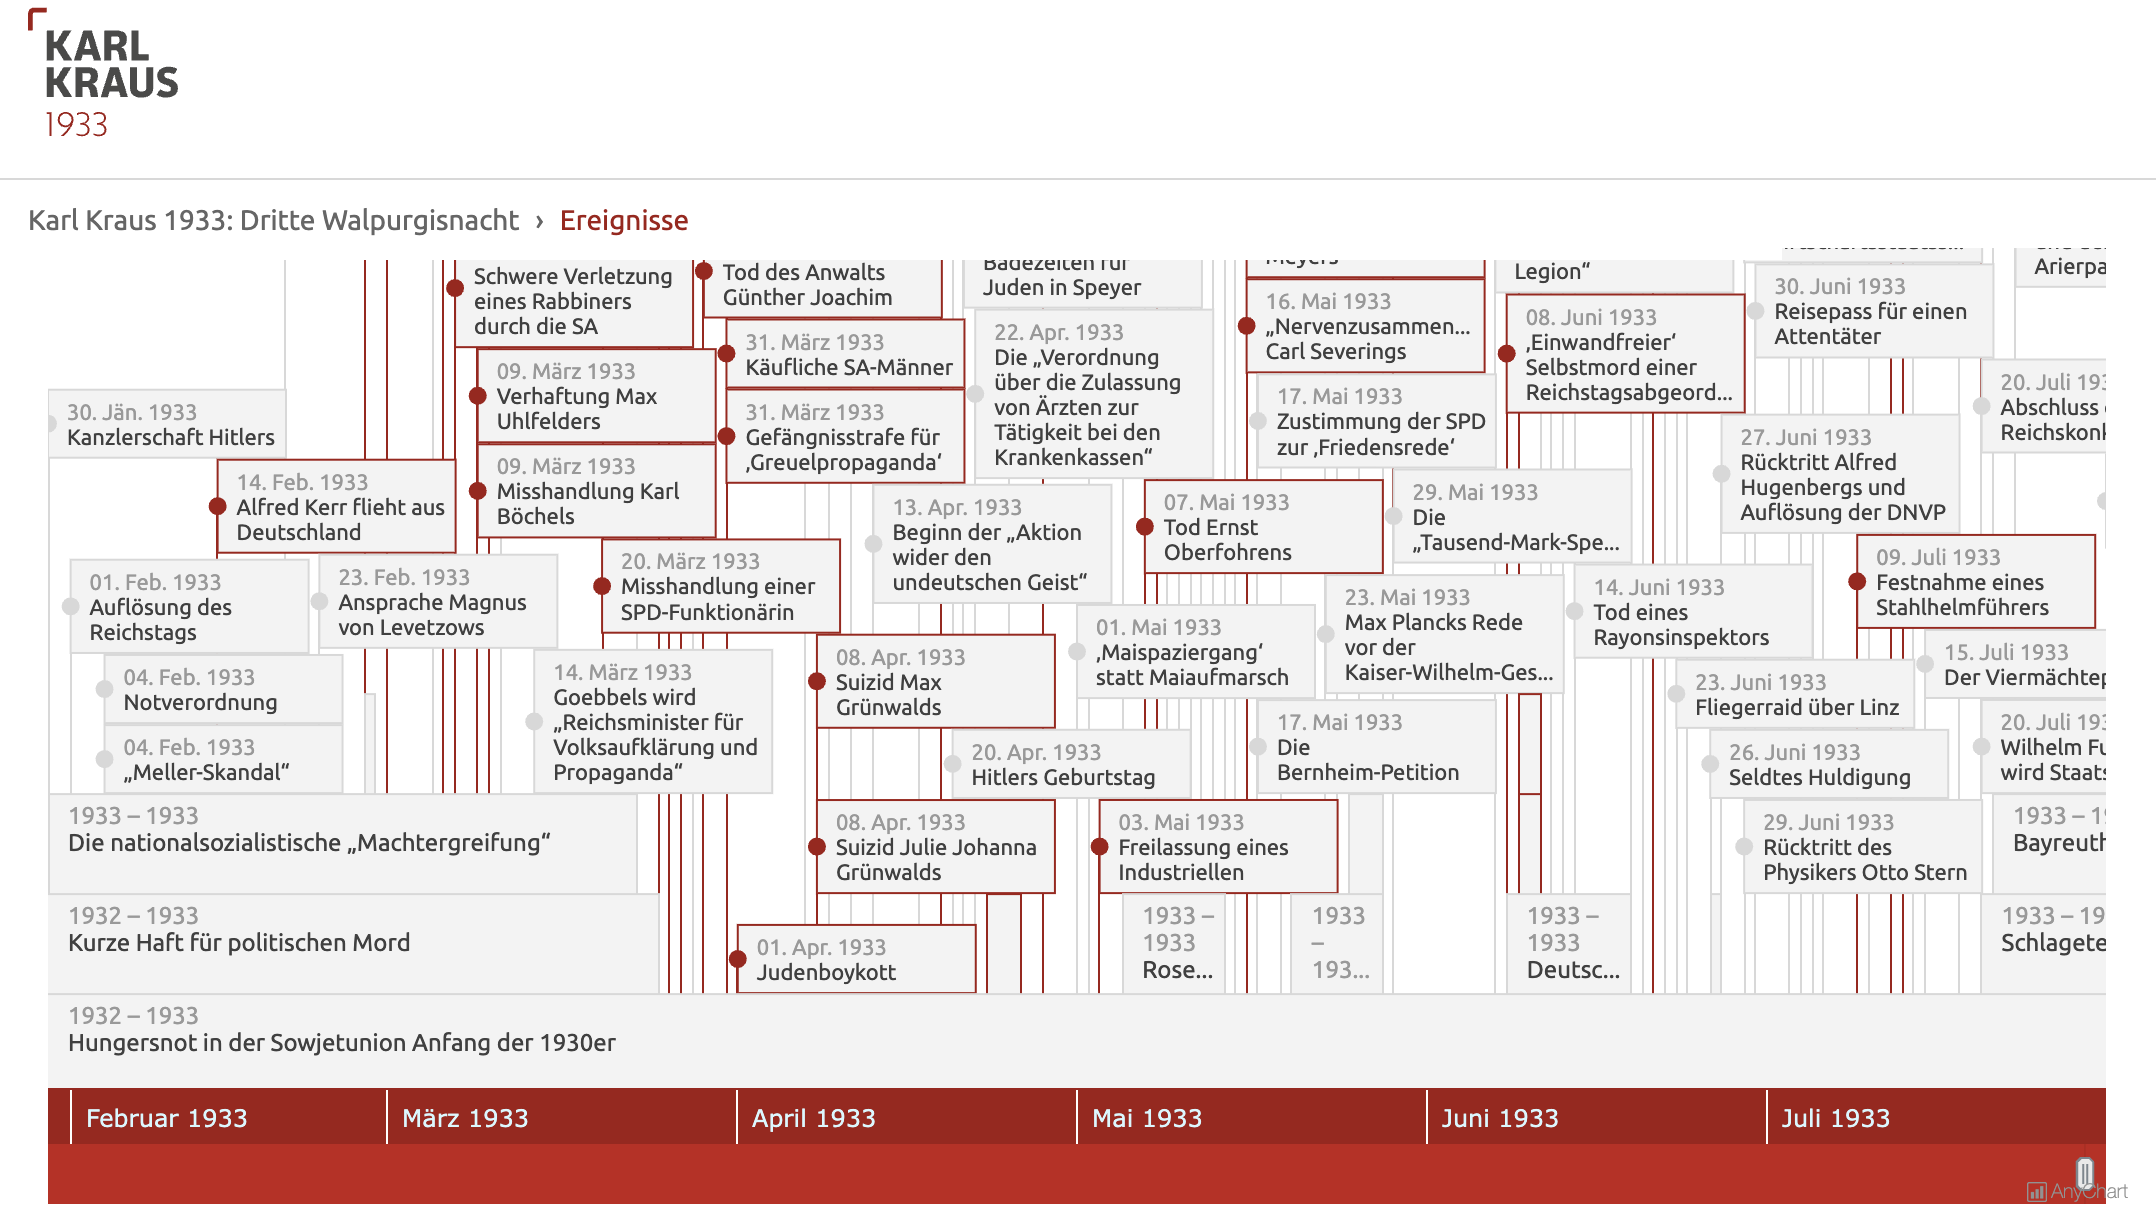 Visualizing data from a literary work can clarify complex structures and patterns, enhancing the understanding of its content and context. For example, a timeline chart can effectively organize events mentioned in the text into an intuitive graphical form, which can be especially beneficial for historical texts. Today, we are pleased to share a project where AnyChart was instrumental in clearly revealing this temporal aspect.
Researchers from the Austrian Academy of Sciences (ÖAW, for Österreichische Akademie der Wissenschaften) have created an expanded digital edition of Third Walpurgis Night by Karl Kraus, an esteemed Austrian writer and satirist, who was nominated three times for the Nobel Prize in Literature. Written in 1933 but published only posthumously in 1952, this essay provides a critical analysis of the early National Socialist rule in Germany. The digital edition integrates the original text into its historical context with extensive commentary, glossary entries, and now also an interactive timeline developed using our JavaScript charting library.
Learn more about the project and how it employs AnyChart in our conversation with Bernhard Oberreither and Barbara Krautgartner from the Austrian Center for Digital Humanities and Cultural Heritage (ACDH-CH) at the ÖAW, who brought this project to fruition. (Stack: eXist-db/TEI Publisher.)
- Categories: AnyChart Charting Component, Big Data, HTML5, JavaScript, Success Stories, Third-Party Developers
- No Comments »
Celebrating Success at Qlik Connect: Recap from AnyChart
July 10th, 2024 by AnyChart Team Qlik Connect 2024 was nothing short of amazing, not just for its vibrant atmosphere but also for the palpable successes we experienced. Beyond the buzz, we showcased our latest advancements for Qlik Sense, gathered a wealth of insights, made meaningful contacts, and ran a hit interactive game that became the talk of the event. We even clinched a win in the social media contest — an unplanned but welcome accolade indeed! Join us for a recap of our time at Qlik Connect in Orlando.
Read more at qlik.anychart.com »
- Categories: Big Data, Business Intelligence, Dashboards, News, Qlik, Success Stories
- No Comments »
AnyChart Triumphs Again: Awarded Best in Data Analytics and Visualization in 2024
February 19th, 2024 by AnyChart Team We are delighted to announce that AnyChart has won the prestigious 2024 DEVIES Awards in the Data Analytics & Visualization category, marking our victory for the second consecutive year!
The award celebrates our JavaScript charting library, continuously acknowledged as the world’s leading data visualization solution for developers. As AnyChart JS forms the cornerstone of our broader product line, this recognition once again highlights the technological excellence and innovation inherent in our entire suite of offerings, including the extensions for Qlik Sense.
- Categories: AnyChart Charting Component, AnyGantt, AnyMap, AnyStock, Big Data, Blogroll, Business Intelligence, Dashboards, Financial Charts, Gantt Chart, HTML5, JavaScript, News, Oracle Apex, Qlik, Stock Charts, Success Stories
- No Comments »
William Dibbern Uses AnyChart JS Charts to Visualize Wedding Guest Data
August 14th, 2023 by AnyChart Team The world’s leader in data visualization, AnyChart has a proven track record of empowering enterprises with robust charting solutions. However, the true essence of AnyChart lies in its versatility — it extends beyond corporate analytics, to making data meaningful in our everyday lives.
For example, meet William Dibbern, an Engineering Manager based in Chicago, who ingeniously applied our JavaScript charting library to his upcoming wedding plans, turning them into a heartfelt blend of technology and emotion.
Join us for an insightful interview with Will as we delve into his journey, exploring how he harnessed the power of AnyChart JS Charts to craft a delightful experience that celebrates love and data in a refreshingly personal way.
- Categories: AnyChart Charting Component, AnyMap, Charts and Art, HTML5, JavaScript, Success Stories, Third-Party Developers
- No Comments »
Freiheit Gruppe Uses AnyChart JS to Visually Organize Berliners’ Ideas for Berlin University Alliance
July 5th, 2023 by AnyChart Team Data visualization is a game-changer when it comes to exploring and making sense of data. And here at AnyChart, we’re passionate about making the development of interactive charts a breeze. Our award-winning JavaScript charting library is not only trusted by the big players in enterprise data intelligence systems, with over 75% of Fortune 500 companies relying on it. It is a go-to choice for thousands of developers worldwide who want to easily create awesome visualizations for their – and their clients’ – websites and apps.
Recently, we discovered a stunning sunburst chart powered by AnyChart on the website of the Berlin University Alliance. This diagram effectively organizes the ideas submitted by Berliners within the framework of the #Berlinforschtmit project, which calls upon the local community to tip scientists regarding new research topics. These collective efforts aim to make significant contributions toward enhancing the quality of life in the city.
We’ve had the pleasure of having a quick conversation with Björn Knetter from Freiheit Gruppe, the team responsible for the design and technical implementation of #Berlinforschtmit. He told us more about this innovative initiative and how they leverage AnyChart for impactful data visualization. All aboard for our quick interview!
- Categories: AnyChart Charting Component, Big Data, HTML5, JavaScript, Success Stories
- No Comments »
MARVI Project Uses AnyChart Android Charts to Visualize Groundwater Data in MyWell App
May 25th, 2023 by AnyChart Team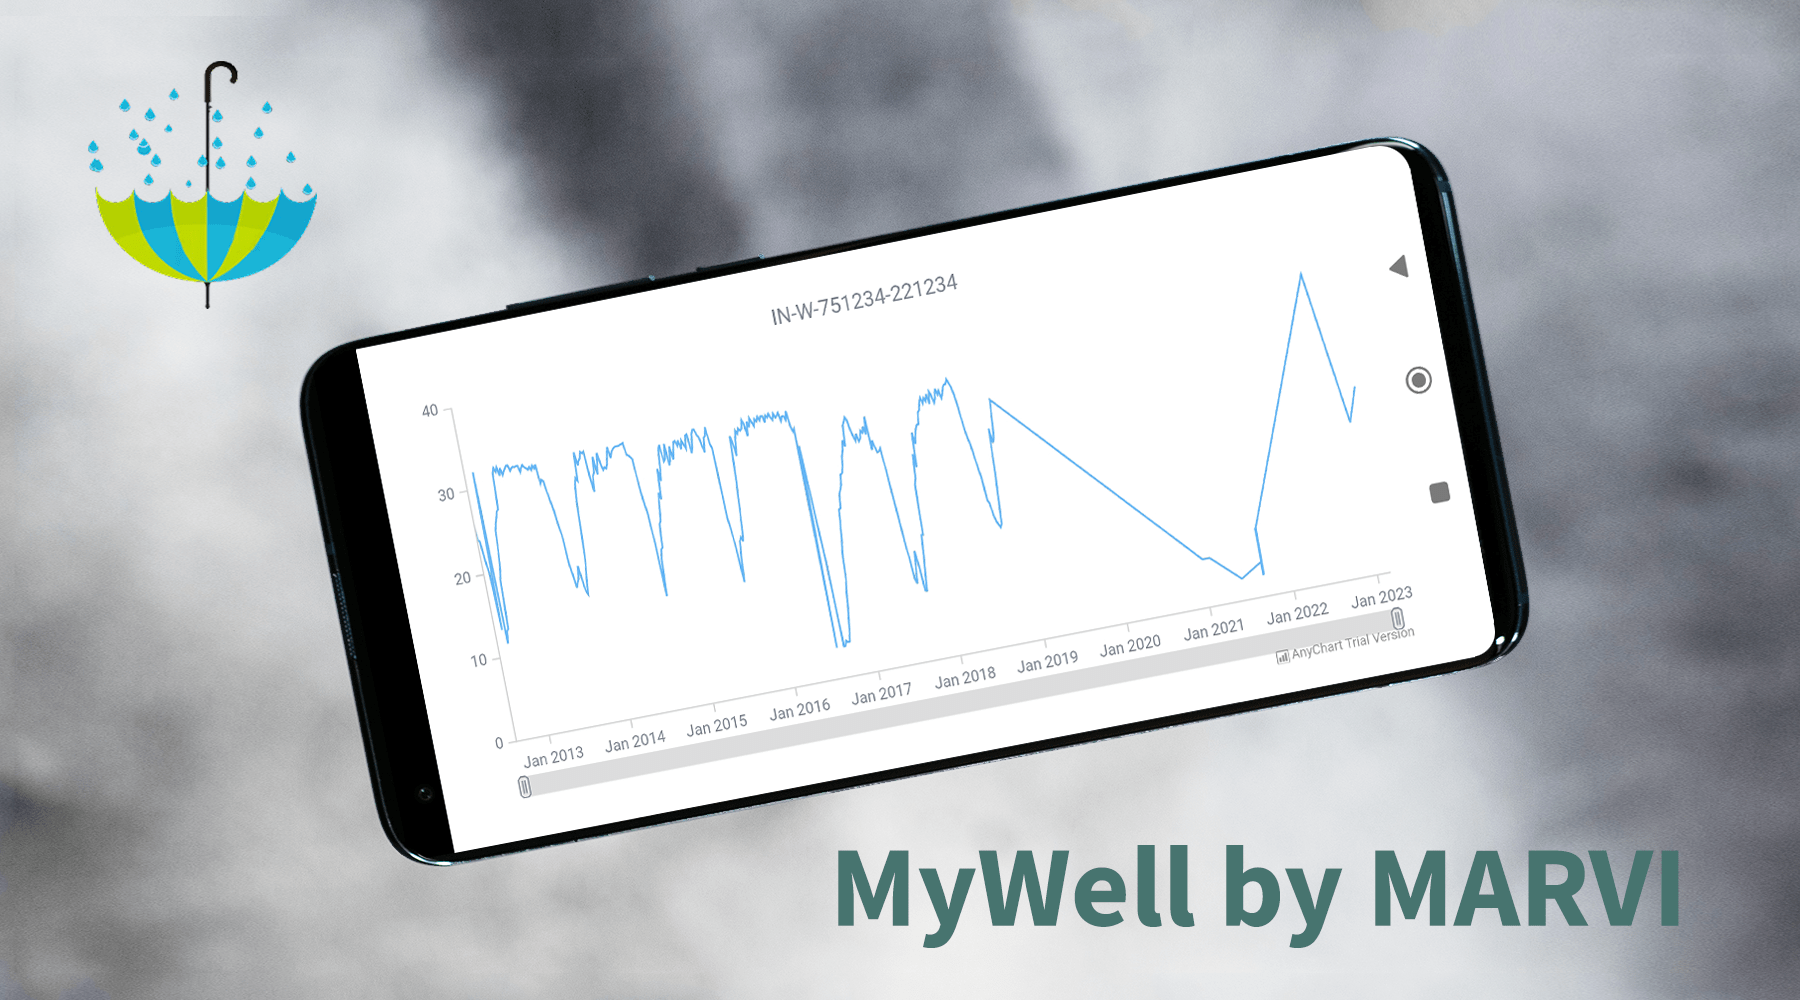
At AnyChart, we take great pride in our position as leaders in the global data visualization industry. Our JavaScript Charting Library is renowned for its excellence for developers, while our Qlik Sense Extensions continue to push the boundaries with innovative solutions for analysts. But we don’t stop at being awesome! We also bring the ultimate data visualization magic to Android app developers with AnyChart Android Charts! You’ve probably come across these charting wonders in some of your favorite mobile apps. Today, we’re putting the spotlight on one specific use case that caught our attention.
We recently had a blast speaking with Professor Basant Maheshwari, the lead scientist at the MARVI project. Their mission? To revolutionize groundwater management through community empowerment. They are achieving that with the help of MyWell, a mobile app that streamlines crowdsourced data collection to sustain groundwater resources, ensure access to clean drinking water, and boost livelihoods. MyWell harnesses the power of our Android data visualization library. And to fuel MARVI’s noble mission, we provided them with a complimentary license to wield the mighty AnyChart within the app.
Dive into the inspiring world of MARVI and MyWell, and witness firsthand how AnyChart contributes to making a real difference for ordinary people while paving the way for the future of groundwater management.
- Categories: AnyChart Charting Component, AnyStock, Big Data, HTML5, JavaScript, Stock Charts, Success Stories
- No Comments »
Nick Mar Uses AnyChart JS Charts to Visualize User Performance and Stock Market Data
April 24th, 2023 by AnyChart Team As the world’s top provider of cutting-edge data visualization solutions, we are constantly thrilled to witness how our products are utilized by both businesses and individuals to create interactive charts and dashboards. We recently had the opportunity to chat with software developer Nick Mar, who shared some of his personal projects with us, highlighting the use of AnyChart and his experience with our JavaScript charting library. Check out our interview with him! (Stack: HTML/CSS/JavaScript.)
- Categories: AnyChart Charting Component, HTML5, JavaScript, Success Stories
- No Comments »
Italian Gruppo Astrofili Galileo Galilei Uses AnyChart JS Charts for Astronomical Data Visualization
March 9th, 2023 by AnyChart Team We are glad to continue supporting non-profit initiatives all over the world by allowing them to use our JavaScript charting library free of charge. Recently, Giorgio Mazzacurati of Gruppo Astrofili Galileo Galilei, an Italian association of amateur astronomers, told us about how AnyChart helps with their visual data analysis. He also shared a few snapshots showing our interactive JS charts in action. Take a look! (Stack: Python/Flask/MySQL.)
- Categories: AnyChart Charting Component, AnyStock, Big Data, Dashboards, HTML5, JavaScript, Success Stories
- No Comments »
AnyChart Named Best in Data Analytics & Visualization 🏆
February 3rd, 2023 by AnyChart Team We’re proud to announce that AnyChart has won a prestigious 2023 DEVIES Award in the Data Analytics & Visualization category! Many thanks to the jury and congratulations to all our partners and customers!
Celebrating 20 years in the market this year, we at AnyChart have been working hard to develop the best-in-class data visualization solutions. And we will keep innovating and excelling!
The DEVIES Awards are the definitive annual awards for the software industry, recognizing outstanding design, engineering, and innovation in developer technology across multiple categories. This year’s winners were selected from record-high hundreds of nominations by an expert-led panel of the DevNetwork Advisory Board, including representatives of Accenture, DigitalOcean, EA, Google, IBM, Salesforce, and other great companies.
- Categories: AnyChart Charting Component, AnyGantt, AnyMap, AnyStock, Big Data, Business Intelligence, Dashboards, Financial Charts, Gantt Chart, GraphicsJS, HTML5, JavaScript, News, Oracle Apex, Qlik, Stock Charts, Success Stories
- 2 Comments »