How to Use Excel with Qlik Sense: Comprehensive Guide
January 21st, 2026 by AnyChart Team Microsoft Excel has been declared obsolete countless times. Yet even with the rise of modern BI platforms like Qlik Sense by Qlik, spreadsheets remain central in enterprise analytics. And that is unlikely to change anytime soon.
These two worlds are not rivals; they complement each other. Qlik Sense delivers trusted data, scale, and interactive dashboards. Excel gives formulas, quick checks, and everyday collaboration in an interface everyone knows. Together, they bring a single source of truth plus the familiar flexibility of spreadsheets.
This article provides a comprehensive guide to using Excel with Qlik Sense. We will cover methods from simple exports and imports to advanced integrations such as automated reporting, live connectors, and embedding fully functional spreadsheets directly into Qlik dashboards.
Continue reading at qlik.anychart.com »
- Categories: AnyChart Charting Component, Big Data, Business Intelligence, Dashboards, Qlik, Third-Party Developers, Tips and Tricks
- No Comments »
How to Create Excel-Style Spreadsheets in Qlik Sense
December 17th, 2025 by AnyChart Team Many teams still rely on Excel because it is familiar, flexible, and fast for ad-hoc analysis. But when spreadsheet work happens outside Qlik, it often means extra exports, duplicate files, and numbers that can drift away from what your dashboards show.
This tutorial shows how to create an Excel-style spreadsheet directly inside Qlik Sense using the Spreadsheets extension, so users can work in a familiar spreadsheet interface without leaving the app.
See the tutorial at qlik.anychart.com »
- Categories: AnyChart Charting Component, Big Data, Business Intelligence, Dashboards, Financial Charts, Qlik, Third-Party Developers, Tips and Tricks
- No Comments »
Enhancing AI-Assisted JavaScript Chart Development with Context7 MCP and Claude
November 26th, 2025 by AnyChart Team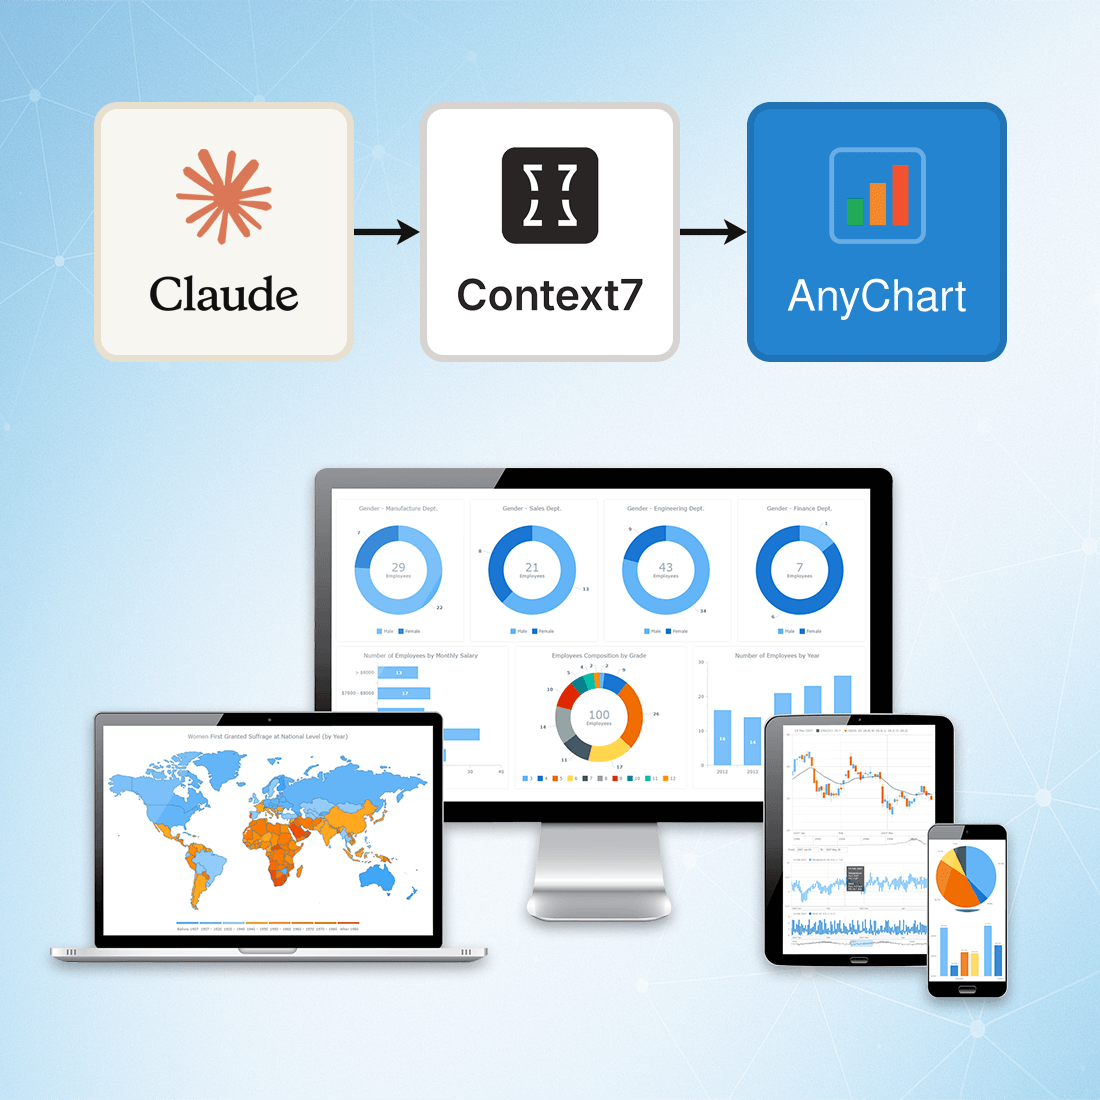 At AnyChart, we are constantly exploring tools and workflows that help developers work more efficiently, stay up to date, and minimize friction when integrating data visualization into their projects.
One approach we’ve recently tested — and found highly effective — is connecting Claude to Context7 via the Model Context Protocol (MCP). This integration gives Claude access to a continuously updated, extensive database of technical documentation across libraries, packages, and APIs.
This means you can rely on Claude not just for reasoning, but also for live, accurate, and authoritative documentation retrieval, dramatically reducing the chances of outdated suggestions or hallucinated methods.
- Categories: AnyChart Charting Component, AnyGantt, AnyMap, AnyStock, Big Data, Business Intelligence, Charts and Art, Dashboards, Financial Charts, Gantt Chart, GraphicsJS, HTML5, JavaScript, JS Chart Tips, News, Stock Charts, Third-Party Developers, Tips and Tricks
- No Comments »
Powering Financial Charts in Free Online Currency Converter by EODHD APIs
April 21st, 2025 by AnyChart Team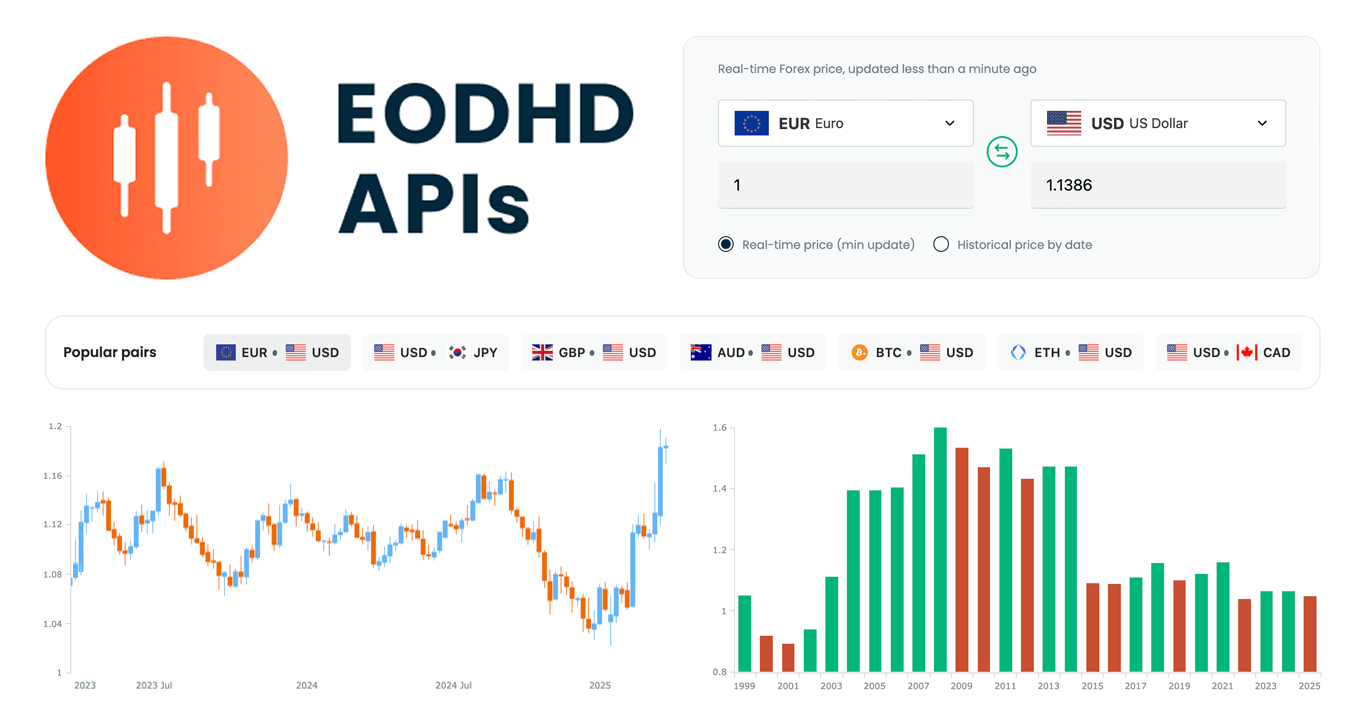 We are pleased to share that EODHD APIs, a prominent provider of financial market data, selected our JavaScript charting library to power charts in their new Online Currency Converter.
The tool provides free access to both live and historical exchange rates for more than 1,100 currency pairs. Interactive stock charts, built with our specialized AnyStock product, enrich numerical conversion data with clear visual context, providing insight into currency dynamics over time.
This case highlights how charts built with AnyChart can add clarity and usability to financial tools. Let’s take a closer look at how it works.
- Categories: AnyChart Charting Component, AnyStock, Big Data, Financial Charts, HTML5, JavaScript, News, Stock Charts, Third-Party Developers
- No Comments »
Integrating AnyChart JS Charts in Python Django Financial Trading Dashboard
December 3rd, 2024 by Michael Whittle We are pleased to share an insightful article by Michael Whittle, a seasoned solution architect and developer with over 20 years of experience. Originally published on EODHD.com, it explores how he integrated our JavaScript charting library into a financial trading dashboard built with Python Django. Michael also shares his experience migrating a treemap from D3.js to AnyChart and explains why he chose our solution for implementing a stock chart, highlighting the intuitive code and enhanced functionality. Read on to discover how you can elevate your financial data visualizations in Python Django web applications with AnyChart JS Charts.
- Categories: AnyChart Charting Component, AnyStock, Big Data, Dashboards, Financial Charts, HTML5, JavaScript, Stock Charts, Third-Party Developers, Tips and Tricks
- No Comments »
Austrian Academy of Sciences (ÖAW) Uses AnyChart JS for Literary Data Visualization
September 17th, 2024 by AnyChart Team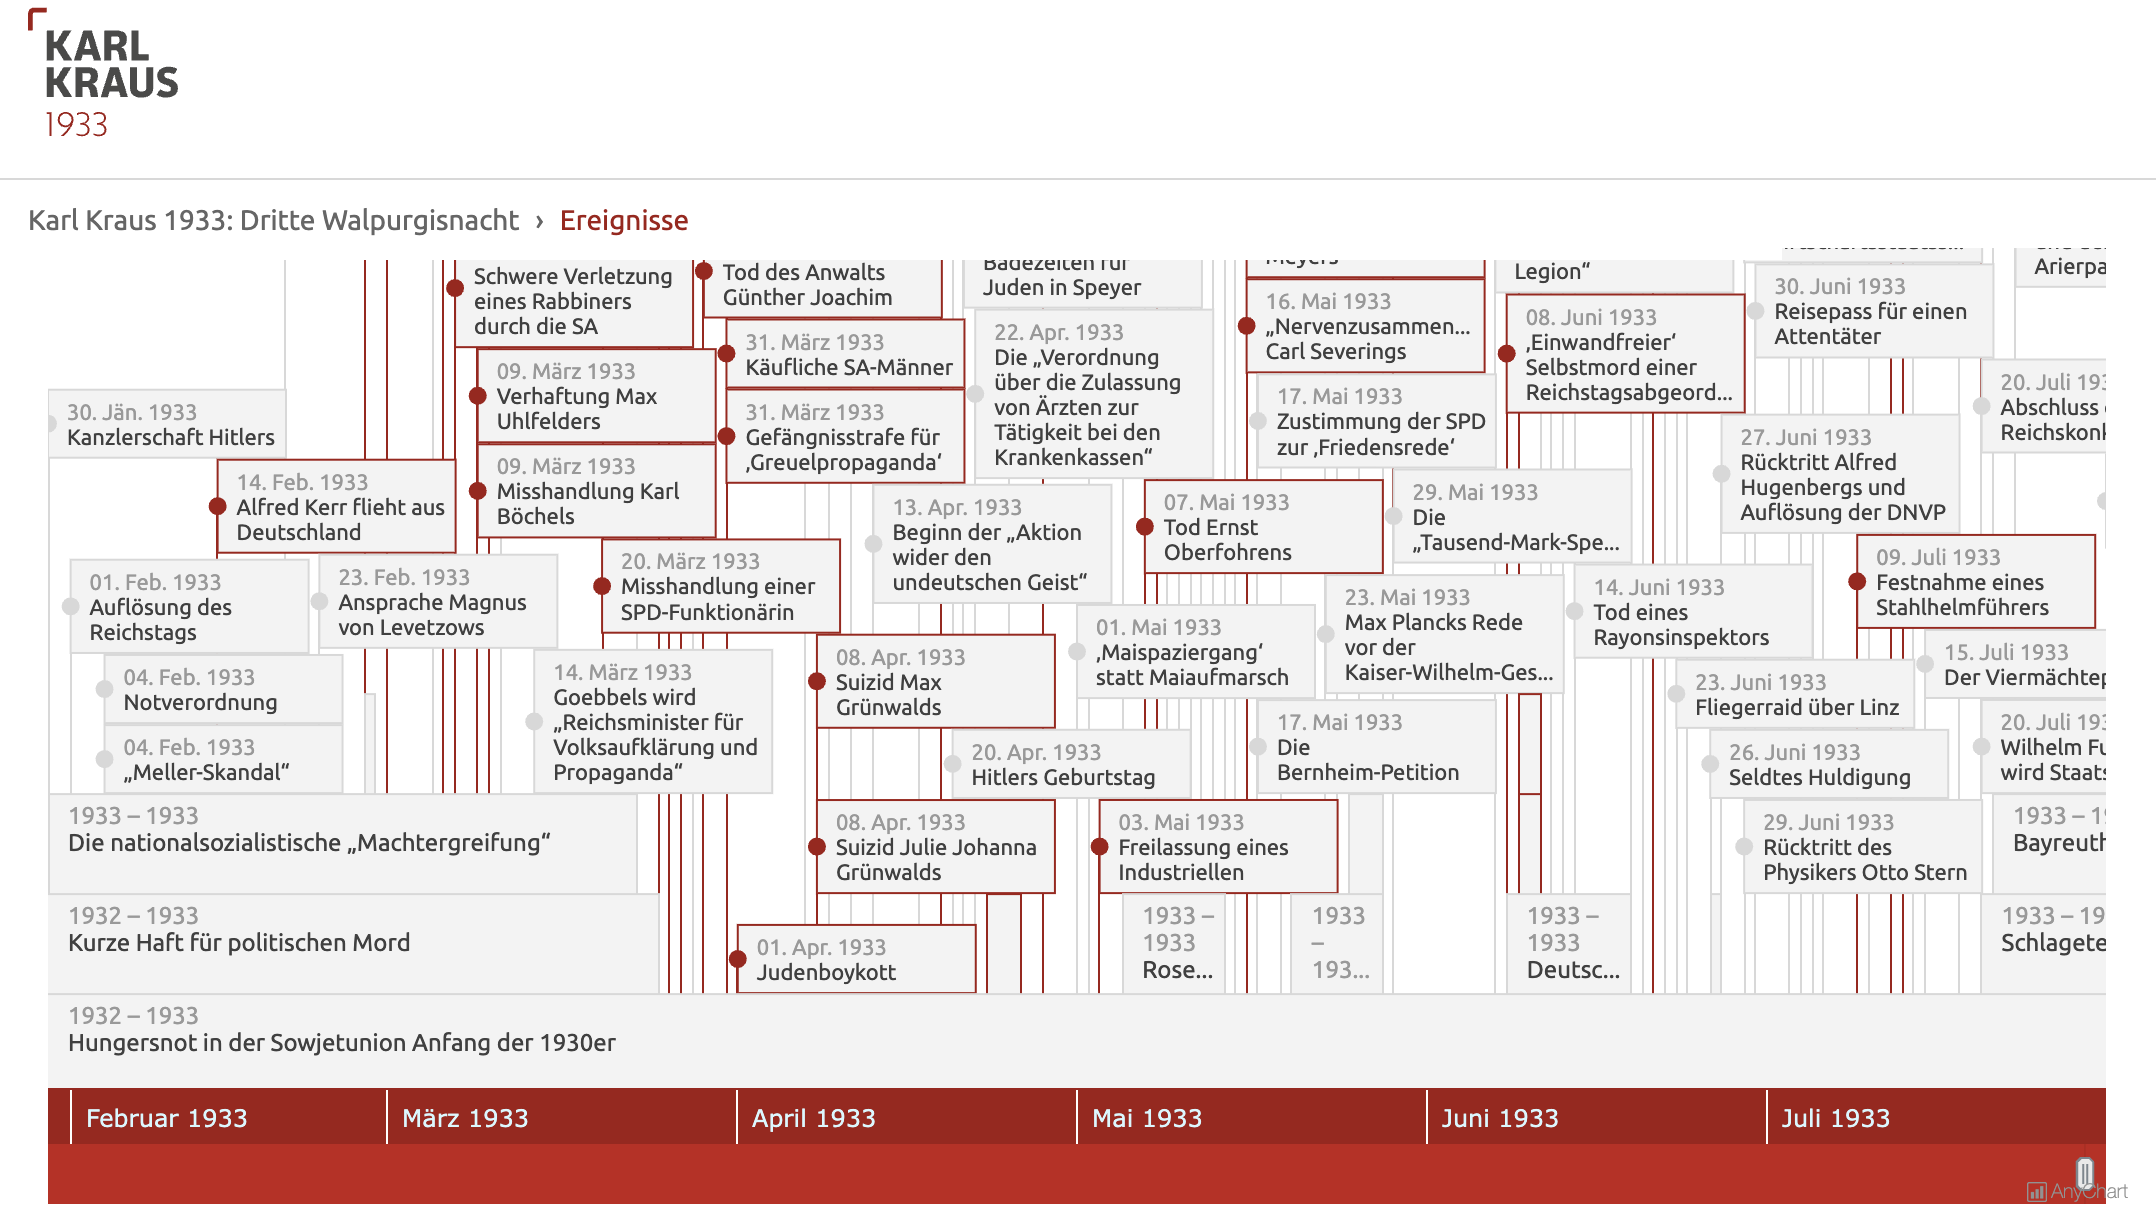 Visualizing data from a literary work can clarify complex structures and patterns, enhancing the understanding of its content and context. For example, a timeline chart can effectively organize events mentioned in the text into an intuitive graphical form, which can be especially beneficial for historical texts. Today, we are pleased to share a project where AnyChart was instrumental in clearly revealing this temporal aspect.
Researchers from the Austrian Academy of Sciences (ÖAW, for Österreichische Akademie der Wissenschaften) have created an expanded digital edition of Third Walpurgis Night by Karl Kraus, an esteemed Austrian writer and satirist, who was nominated three times for the Nobel Prize in Literature. Written in 1933 but published only posthumously in 1952, this essay provides a critical analysis of the early National Socialist rule in Germany. The digital edition integrates the original text into its historical context with extensive commentary, glossary entries, and now also an interactive timeline developed using our JavaScript charting library.
Learn more about the project and how it employs AnyChart in our conversation with Bernhard Oberreither and Barbara Krautgartner from the Austrian Center for Digital Humanities and Cultural Heritage (ACDH-CH) at the ÖAW, who brought this project to fruition. (Stack: eXist-db/TEI Publisher.)
- Categories: AnyChart Charting Component, Big Data, HTML5, JavaScript, Success Stories, Third-Party Developers
- No Comments »
William Dibbern Uses AnyChart JS Charts to Visualize Wedding Guest Data
August 14th, 2023 by AnyChart Team The world’s leader in data visualization, AnyChart has a proven track record of empowering enterprises with robust charting solutions. However, the true essence of AnyChart lies in its versatility — it extends beyond corporate analytics, to making data meaningful in our everyday lives.
For example, meet William Dibbern, an Engineering Manager based in Chicago, who ingeniously applied our JavaScript charting library to his upcoming wedding plans, turning them into a heartfelt blend of technology and emotion.
Join us for an insightful interview with Will as we delve into his journey, exploring how he harnessed the power of AnyChart JS Charts to craft a delightful experience that celebrates love and data in a refreshingly personal way.
- Categories: AnyChart Charting Component, AnyMap, Charts and Art, HTML5, JavaScript, Success Stories, Third-Party Developers
- No Comments »
20+ Electoral Maps Visualizing 2020 U.S. Presidential Election Results — DataViz Weekly Special Edition
November 6th, 2020 by AnyChart Team All eyes on election maps! Yes, they could be misleading. And even widely misleading. But it can be at least so fascinating to look at them, especially at times like this! So, we have curated a list of over twenty reputable resources — as of now, to be precise, 24 and counting! — where you can watch the live results of the 2020 United States Presidential election in compelling data visualizations. At the same time, it is a great chance for you to investigate and understand how election maps (and some other graphics) can look and work in practice.
? See also: 2024 U.S. Election Maps (November 2024).
Vote counts may be different on different platforms and update as more data becomes available out there — it’s absolutely okay. The election results are still partial. Over the coming days, all numbers will be adjusted to match the real, final vote count. Just in case: We’ve added only reliable sources — notable, reputable media outlets.
Without further ado, check out maybe the most important data visualizations these days! (Electoral vote count numbers in the text last updated on November 9th, 2020, for each source.)
- Categories: Data Visualization Weekly, News, Third-Party Developers
- 3 Comments »
JS Charting Without Borders: 21 New Integration Templates for Popular Stacks
December 19th, 2016 by AnyChart TeamMaking your data visualization life ever easier is what we at AnyChart are boundlessly passionate about. This time we focused on further simplifying the integration of our JS charting solutions into your web development environment.
So, prepare to replan your schedule! From now on, you will spend tangibly less time on charting. And please greet the 21 New Technical Integration Templates that we have just released! They will help you deploy HTML5 graphs, maps, stock charts, dashboards, and Gantt diagrams in your stack as easily (and rapidly!) as never before, no matter what programming languages, frameworks, and databases are used.
You can find the templates right here on our website, in the Technical Integrations section.

Basically, our powerful JavaScript/HTML5 based solutions for interactive data visualization – AnyChart, AnyMap, AnyStock, and AnyGantt – are inherently compatible with all major technologies and platforms. Configuring each JS charting library is easy, and we are sure all of you are more than capable of making even rather complicated integrations prefectly done by yourself. But we keep on doing our best to bring you the ultimate simplicity and clarity so you could get along without additional research and other time-consuming activities.
The integration templates we’ve added cover the most popular languages, frameworks and libraries, and database programs. Below is the list of the newly available combinations.
Templates for easily integrating AnyChart JS charting libraries into your stack:
 |
ASP.NET integration
|
 |
Go integration
|
Java integration
|
 |
Julia integration
|
 |
NodeJS integration
|
Perl integration
|
PHP integration
|
Python integration
|
 |
R integration
|
Ruby on Rails integration
|
Scala integration
|
We hope you agree that this is a tremendous addition to the JS charting integration samples published earlier:
- Clojure, ClojureScript and PostgreSQL,
- iOS, Objective-C and SQLite,
- NodeJS and MongoDB,
- PHP and MySQL,
- PHP, Slim and MySQL.
So, you are welcome to make use of our integration templates and samples for easier data visualization. All of them are released on GitHub under the Apache 2.0 License, rest in the AnyChart Integrations repository, and can be forked and changed in any way.
We are going to keep the collection growing further. Meanwhile, please send us your suggestions on what other particular integration you are interested to learn about first, and – as always! – that one will be prioritized; just contact our Support Team for that and name your stack.
To make your JS charting life even easier, we will release special AnyChart plugins for Angular, Ember, jQuery, Meteor, and React JavaScript frameworks in February 2017, with the 7.13.0 update. But this is a completely other remarkable story. Stay tuned. And thanks for being with us!
- Categories: AnyChart Charting Component, AnyGantt, AnyMap, AnyStock, Business Intelligence, Dashboards, Financial Charts, Gantt Chart, HTML5, JavaScript, News, Stock Charts, Third-Party Developers, Tips and Tricks
- 2 Comments »
AnyChart Open-Sources Powerful, Draw-Anything JS Graphics Library GraphicsJS
September 15th, 2016 by AnyChart TeamIt is a pleasure for us to announce this today! We have just launched GraphicsJS, a free, open-source, lightweight JavaScript library which allows you to draw any JS graphics and animation for your HTML5 projects very easily. It is significantly more powerful and feature-rich than Raphaël, BonsaiJS, and other formerly leading SVG/VML graphics solutions.
")
GraphicsJS has always been the graphics engine that our JavaScript (HTML5) charting libraries are built on – AnyChart, AnyStock, AnyGantt, and AnyMap. As a result, it already powers data visualization activities for many of you – Oracle, Microsoft, Volkswagen, AT&T, Samsung, BP, Bosch, Merck, Reuters, Bank of China, Lockheed Martin, and thousands of all the other highly respected AnyChart’s customers including more than 70% of Fortune 1000 companies.
Of course, data visualization is not the only but just one of multiple fields where the library of GraphicsJS can be helpful and even essential. Generally speaking, this solution can help you produce virtually anything graphical from scratch: static and animated images, cartoons, games, interactive infographics, mind maps, and many other amazing things in HTML5.
Key Features of JS Graphics Library
- Mighty line drawing abilities – Bézier curves, arcs, rectangles, and many other kinds of forms and deformations.
- Powerful text manipulation features – multiline texts, measurement, including width, height, as well as wrap, overflow, indent, spacing, align, etc.
- Virtual DOM for drawing fast and only what is necessary.
- Smart layering system with z-index.
- Transformation engine – embarrassing in-browser transformations are not used.
- Legacy browser support (Internet Explorer 6+).
- Concise and convenient JavaScript API with chaining support.
By the way, making our graphics engine open-source is just the beginning as – we are also pleased to tell you – AnyChart is going to open the source code of our charting libraries soon! We believe that our great developments in the fields of graphics and data visualization should be even more visible and reachable to any programmer from any part of the world, not to mention that we would love to allow the community to contribute.
Please refer to GraphicsJS.org to learn more about GraphicsJS. As always, the demos are available on our Playground (Graphics section). Also, let’s not forget about the Graphics Documentation and Graphics API Reference.
What’s more, the GraphicsJS library and all relevant samples can be freely downloaded and forked on GitHub.
- Categories: AnyChart Charting Component, AnyGantt, AnyMap, AnyStock, Charts and Art, Dashboards, Financial Charts, Gantt Chart, GraphicsJS, GraphJam, HTML5, JavaScript, News, Stock Charts, Third-Party Developers, Tips and Tricks, Uncategorized
- 5 Comments »