June 15th, 2011 by Timothy Loginov
Today, we are glad to publish a new success story: Auditr have chosen AnyChart to visualize healthcare data.
Auditr (http://www.auditr.com/) is an online, totally web-based service designed specially for hospitals and healthcare organizations. It helps to provide assurance, get early warning of potential problems, and improve performance. With Auditr, users can collect data, report and discuss the results, develop and monitor action plans. Auditr is developed by Internet Learning Ltd, a company that previously built learning management systems used in the field of healthcare.
The challenge was to visualize time-based and statistical data for reports in the form of line, bar, meters and heatmap charts and to make the charts interactive so that an end-user could proceed to more detailed information by clicking a particular point of a chart.
AnyChart was chosen as a solution – the component allows creating a wide variety of fully configurable charts, and all data is easily set in XML format. Using AnyChart’s interactivity options, actions that should be performed when a user clicks a point on a chart were defined.
Enjoy the full story:
Other stories can be found at: https://www.anychart.com/company/success_stories.php
June 9th, 2011 by Margaret Skomorokh
Charts make people not only understand numbers, but also laugh.
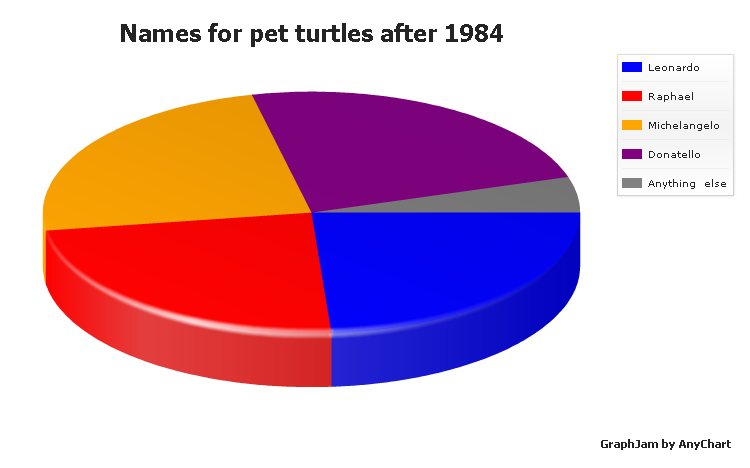
GraphJam is a website showing music and popular culture in funny charts and graphs created by users. These charts can be viewed as a form of modern Internet folklore – signed by nicknames, they are half anonymous, and most witty ones are often reposted by other users in blogs and social networks, which resembles the way folklore spreads.
The fact that charts can be used in such an unexpected and curious way truly inspires us. And it was difficult to stay aside, not trying to apply here AnyChart’s vast capabilities and make some especially interesting items posted at GraphJam even more expressive.
All our charts are fully configurable and nice-looking, so they show the best advantage of any information, including even jokes. One of the many types supported by AnyChart is a 3D Pie Chart, and this is our version of a GraphJam 3D Pie Chart:
To check out other examples of Pie and Donut Charts, visit our gallery.
We will be posting more charts from GraphJam created by AnyChart.
June 2nd, 2011 by Timothy Loginov
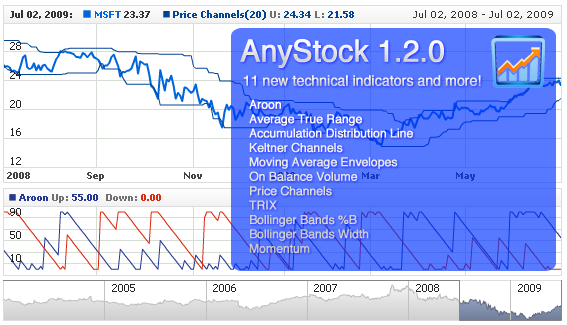
Today we have released a new version of AnyChart Stock and Financial Charts – 1.2.0.
The following new features are available:
- It is now possible to set a time offset in hours for annotation anchor points in the same way it is done for data points or event marker anchors.
- Two new events have been added that allow tracking the beginning and the end of editing annotations.
- Eleven new technical indicators have been added: Aroon, Average True Range (ATR), Accumulation Distribution Line (ADL), Keltner Channels, Moving Average Envelopes (MA Envelopes), On Balance Volume (OBV), Price Channels, TRIX, Bollinger Bands %B, Bollinger Bands Width, Momentum.
Bug fixes:
- The SWC library showed a wrong info in the VERSION constant. This bug has been fixed.
- The error reporting system now works correctly when errors in defining timestamps formats for data sets or data providers are encountered.
Demos and Help Materials updates:
- onAnnotationEditingStart() and onAnnotationEditingFinish() sample handlers have been added.
- The description of new technical indicators has been added.
Full version changes information: http://6.anychart.com/products/anystock7/history/
The roadmap for the next version: http://6.anychart.com/products/anystock7/roadmap/
Download the latest version: https://www.anychart.com/download/
May 17th, 2011 by Timothy Loginov
A new version of AnyChart Stock and Financial Charts is available – AnyStock 1.1.1.
In this version, a new navigation feature has been added: users can now quickly select a particular area of a plot by holding the SHIFT key and moving a mouse, the video below illustrates this feature (and you can do it yourself on any AnyStock chart):
There is also an update of our help materials: a new sample has been added to Online HTML/JS Samples Center: Synchronizing Selected ranges in Two Different Chart Objects.
Two bugs have been fixed. Firstly, when allow_edit attribute forbids editing annotations, the points beneath them are now highlighted correctly. Secondly, using the applySettingsChanges() method no longer makes annotations invisible, and doesn’t prevent from adding new annotations.
Here is the roadmap for future versions of AnyStock: http://6.anychart.com/products/anystock7/roadmap/
May 12th, 2011 by Margaret Skomorokh
AnyChart Stock and Financial Charts is a powerful tool for visualizing any time-based data, not only financial one. For example, AnyStock can perfectly deal with the results of geoscience surveys, which include gathering and analyzing large amounts of data, both real-time and historical.
The success story we are publishing today is about UNAVCO – a non-profit consortium that is dedicated to geoscience research and education using geodesy. UNAVCO collects, stores and makes available to the research community terabytes of geodetic and related time-series data. Much of this data originates from the Plate Boundary Observatory which is a network of over 1,100 permanent GPS stations located in the western U.S., Alaska, Canada and Baja California. These stations measure the slow deformation of the earth’s crust to sub-centimeter accuracy.
The challenge was:
- To plot real-time GPS positions generated by over 300 stations in the PBO network for display on our website.
- To provide researchers time-series plots of hourly meteorological data, collected by station instruments, for the purpose of evaluating environmental factors influencing GPS signals.
- To provide end users the ability of scaling and scrolling time-series plots on-the-fly.
AnyChart Stock and Financial Charts was chosen, being an instrument with full feature set for creating real-time streaming (new data is added without reloading plots). AnyStock also provides rich format, pan and zoom options for easy navigation, which allows working with long term and large data sets.
You can enjoy the success story here:
Other stories can be found here: https://www.anychart.com/company/success_stories.php
April 29th, 2011 by Margaret Skomorokh
Today we publish a new success story: HeadHunter have chosen AnyStock to visualise hh.index.
HeadHunter, founded in 2000, is a leading Russian Internet recruitment company. Its main asset is the hh.ru site, with a base of 120 thousand job offers and 5.5 million CVs. Companies invite through this site 140 thousand candidates weekly. HeadHunter is a part of Mail.Ru Group – a major Russian Internet company, leading in the number of monthly unique visitors in Russian Internet segment, the owner of ICQ instant messaging service and many other IT companies.
The challenge was to visualize hh.index — the balance between the number of resumes and the number of vacancies submitted at the site for a particular period of time, which is an important index of business and economical activity and requires quality tools. It was needed that chart could be customized on-the-fly.
AnyChart Stock and Financial Charts were chosen, being an excellent tool for visualizing time-based data. It allows creating fully customizable interactive charts, displaying long term data sets in a comprehensible form.
You can enjoy the success story here:
Other stories can be found here: https://www.anychart.com/company/success_stories.php
April 27th, 2011 by Timothy Loginov
 We are proud to release AnyStock 1.1.0 – a new version of Stock and Financial Charts component, where some significant features have been added:
Drawing tools and annotations
AnyStock 1.1.0 offers a complete set of shapes for technical analysis that can be added to the chart plot, both programmatically and via user interface. Already added objects are easy to move, change, and remove.
Available shapes include: line segments, rays, trend lines, vertical and horizontal lines, rectangles, ellipses, triangles, trend channels, Andrew’s pitchforks, Fibonacci fans, Fibonacci arcs, Fibonacci retracements, Fibonacci time-zones, buy/sell signals, and custom text labels to mark important points and trends discovered.
Check out the online demo of these tools: AnyChart Stock: Drawing Tools and Annotations Demo.
Flex Component
Flex developers have received the great opportunity to use AnyStock and build smart scrollable charts into their rich internet applications and trading solutions.
Improvements
A huge performance improvement for mouse over the chart area has been made, as well as an improvement in range picker behavior: input values and input masks are now internally trimmed.
Misc
Besides that, a few bugs have been fixed and several minor features have been added, such as:
April 24th, 2011 by Margaret Skomorokh
We wish a happy Easter and a happy week ahead filled with energy and joy to all our existing and future clients!
By the way, a lot of great news is coming soon.
April 19th, 2011 by Margaret Skomorokh
A new success story that we are glad to post here is about a company from the Software Development industry.
Xlinesoft.com is a software development group. It focuses on providing innovative, powerful yet easy-to-use Internet-related software products that are designed for helping users to make Web authoring easy. With Xlinesoft tools, thousands of people can quickly design online applications.
The ability to display charts is critical for any modern rich Internet application, so most users were demanding modules making possible to visualize data from their databases as charts.
AnyChart charting modules were an excellent solution, because the work of the component doesn’t depend on server-side support, which makes it compatible with different kinds of apllications and allows to lower development and licensing costs. Users are pleased with perfect design, usability and multiple configuration options of AnyChart charts.
You can enjoy the success story here:
Other stories can be found here: https://www.anychart.com/company/success_stories.php
April 11th, 2011 by Margaret Skomorokh
We are happy to publish a new success story, this time about Eugeniy Stern – an independent SAP development consultant, who has been working in this field since 1997, assisting large enterprises in oil-producing, oil-refining and transport industries. In some of his projects, he used AnyGantt.
The SAP NetWeaver technology platform enables the composition, provisioning, and management of SAP as well as non-SAP enterprise software applications. There is a built-in solution for creating Gantt charts, but it was found lacking visual appeal needed for business reporting.
After a market research, it appeared that AnyGantt fits best of all the charting components. AnyGantt was recommended to the clients, and during this year, a few projects using AnyGantt in SAP NetWeaver will be launched.
The story can be found here: Eugeniy Stern Recommends AnyGantt to His Clients >>
Other stories: https://www.anychart.com/company/success_stories.php