September 5th, 2011 by Margaret Skomorokh

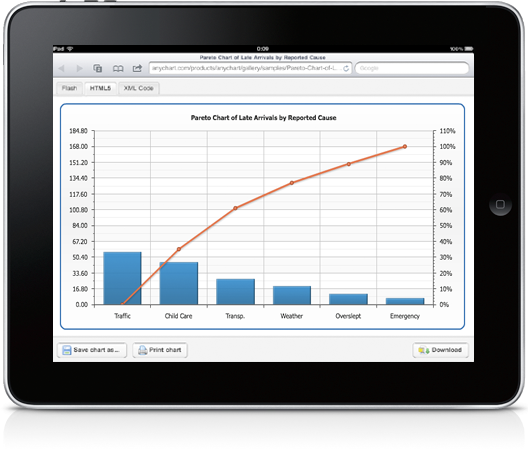
We are glad to announce the release of AnyChart 6.0 containing an HTML5 (SVG based) version of our component.
Our aim is to make the HTML5 version a complete substitution for the Flash version as well as to make the switch to HTML5 as easy as possible. Another thing that we see as a highest priority is the compatibility of our component with different browsers and platforms.
So key features of the HTML5 version are the following:
- HTML5 charts are configured exactly the same way as Flash ones – in XML.
- The names of API methods are the same.
- The HTML5 version is designed to work in all up-to-date versions of popular desktop browsers, such as Chrome, Safari, Firefox, Internet Explorer, and Opera.
- It is also compatible with popular browsers for the mobile platforms Android (2.2+) and iOS (iPhone, iPad, iPod Touch).
Though we have fully integrated the HTML5 version with our documentation as well as with the redistributable package, HTML5 support is still in the beta phase. Not all chart types and not all features are available for the moment, and we do not yet guarantee that all your charts in SVG version will look and work exactly like they do in Flash version.
However, we are going to cover all Flash version features by the HTML5 engine by the end of the year, and you will be able to upgrade your charts without any significant changes in your web sites and applications.
You can see how our HTML5 engine works in the examples from the Documentation and Gallery sections – just select an HTML5 tab when you view a chart. In case the features required to display a certain sample are not ready yet, you will see a relevant message.
To review an instruction on implementation, see HTML5 Migration Guide tutorial.
We are working hard to make the HTML5 version work exactly like the Flash version, and AnyChart will be updated each 1 or 2 weeks this fall. Check our web site or subscribe to our blog RSS or Twitter to be always aware of the latest changes.
Thank you once again for the interest in AnyChart – Modern Data Visualization Solution.
August 22nd, 2011 by Margaret Skomorokh
We have released an update of AnyChart Stock and Financial Charts, AnyStock 1.5.0, with the following changes:
New features
- The ability to set different left and right timescale margins in pixels has been added. Read more at: Timescale Right and left paddings.
- We have added a new parameter in the applySettingsChanges() method: preserveSelectedRange, which allows to preserve selected range when chart settings are modified.
Bug fixes
- The bug in the version 1.4.0 that lead to incorrect placement of event markers is fixed.
So if you work with AnyStock 1.4.0 and use the event markers feature, you have to update to the version 1.5.0.
Documentation updates
Download AnyStock 1.5.0: https://www.anychart.com/download/
Version history: http://6.anychart.com/products/anystock7/history/
July 29th, 2011 by Margaret Skomorokh
We continue posting tips from Edward Tufte‘s works. In The Visual Display Of Quantitative Information, he puts a lot of attention to the problem of lying in charts.
It is assumed that charts are aimed to show the truth about data in the most demonstrative way, but this demonstrativeness is a two-edged weapon. Owing to some tricks – or mistakes – data may seem not what they are. One of them is the lack of context.
According to Tufte,
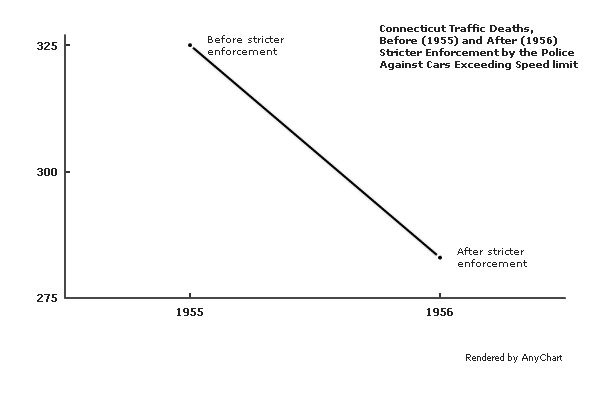
To be truthful and revealing, data graphics must bear on the question at the heart of quantitative thinking: “Compared to what?” The emaciated, data-thin design should always provoke suspicion, for graphics often lie by omission, leaving out data sufficient for comparisons.
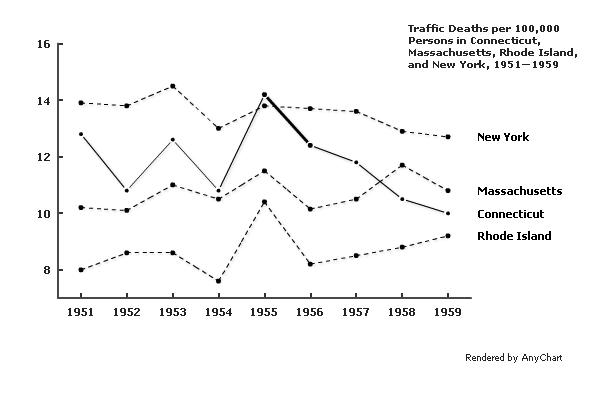
The author gives an example of such a graphic – it shows the number of traffic deaths before and after stricter enforcement by the police against cars exceeding the speed limit:
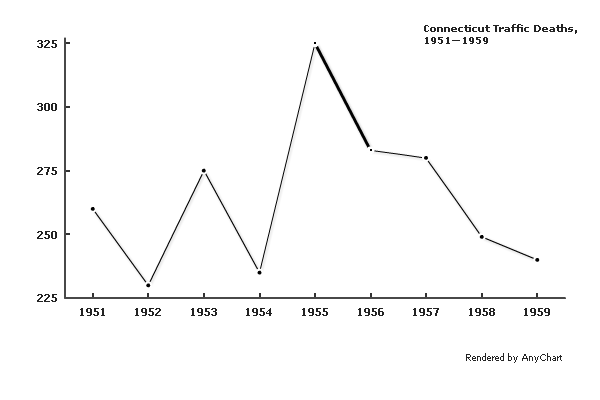
A few more data points make the situation much clearer:
A different context would cause a very different interpretation:
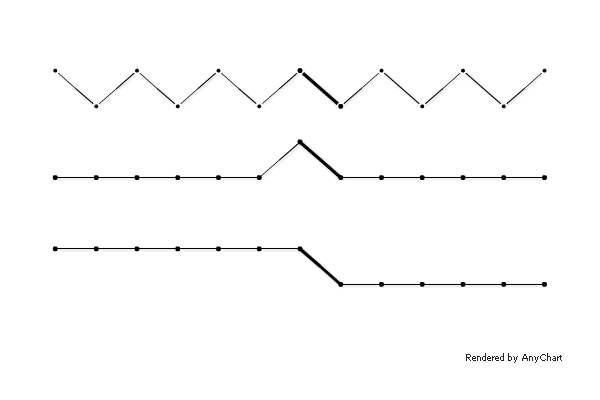
Comparison to adjacent states shows that the crackdown on speeding decreased the number of traffic fatalities not only in Connecticut:
Of course, if one needs to distort the meaning of data, concealing the context may be a relatively useful tip, but in other situations, it is definitely a mistake. The principle formulated by Edward Tufte is:
Graphics must not quote data out of context.
July 22nd, 2011 by Margaret Skomorokh
Among numerous chart types that AnyChart allows creating there are 3D Column Charts. Using this tool, we have made our version of a GraphJam chart that wittily mocks the good old Lord of the Rings trilogy:
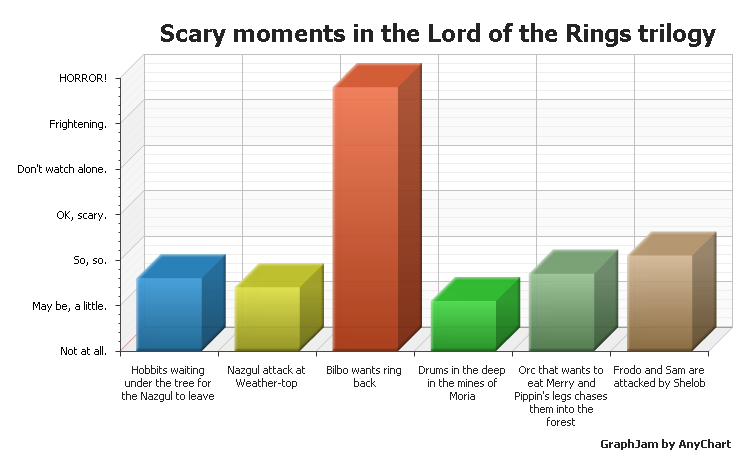
To check out other examples of 3D Column Charts, visit 3D Column Charts section in AnyChart charts gallery.
July 6th, 2011 by Margaret Skomorokh
The ability to set left and right timescale paddings in pixels was in extreme demand, and we always do our best to provide our customers with as wide range of built-in technical indicators as possible – so we have decided not to put off the AnyStock 1.4.0 update that gives you the full control of timescale margins and three new technical indicators:
Thus, AnyStock has become even better than before and now supports already 30 built-in and ready-to-use technical indicators.
Download AnyStock 1.4.0: https://www.anychart.com/download/
Version history: http://6.anychart.com/products/anystock7/history/
July 6th, 2011 by Margaret Skomorokh
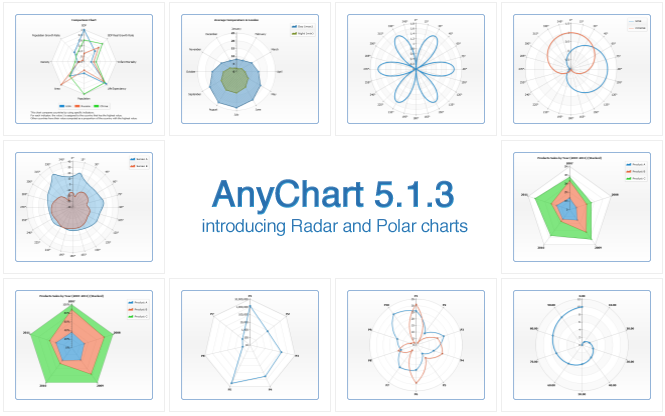
We are proud to announce the availability of the long-awaited AnyChart 5.1.3 with new chart types and numerous fixes and improvements!
New chart types
- Radar Chart
A radar chart is a graphical method of displaying multivariate data. Variables are represented on axes starting from the same point, where the relative position and angle of the axes is uninformative. It is also known as spider chart, star chart, kiviat diagram, etc. AnyChart allows displaying three types of series on radar charts: Line, Area and Marker.
- Polar Chart
A polar chart is a plot drawn on a circular grid, showing trends in values on the basis of angles: each point on a plane is determined by a distance from a fixed point and an angle from a fixed direction. AnyChart allows drawing Line, Area and Marker series on polar plots.
New features
- A new external method that allows animating updated values.
- New formatting keywords that allow controlling the number of characters in token: maxChar and maxCharFinalChars.
- New parameters in chartMouseMove, pointMouseOut, pointMouseOver events: mouseX and mouseY.
- Multiseries pie and donut charts can now use outside labels with connectors.
Bug fixes
- Minor missing values interpolation algorithm issue is fixed.
- Flex component “tooltip stick” problem is solved.
- Wrong positioning of labels for points with zero value is fixed.
Download AnyChart 5.1.3: https://www.anychart.com/download/
Version history: http://6.anychart.com/products/anychart7/history/
July 1st, 2011 by Margaret Skomorokh
Today, AnyChart Stock and Financial Charts 1.3.0 is available. In the new version, several important improvements have been made:
New technical indicators
New features
Bug fixes
- Grouping of data provider fields with “High” and “Low” approximation types was incorrect.
- Volume+MA indicator worked improperly with ma_period attribute. This error has been fixed.
Download AnyStock 1.3.0: https://www.anychart.com/download/
Version history: http://6.anychart.com/products/anystock7/history/
Roadmap: http://6.anychart.com/products/anystock7/roadmap/
June 21st, 2011 by Margaret Skomorokh
Edward Rolf Tufte is an American statistician and professor emeritus of political science, statistics, and computer science at Yale University. He is noted for his writings on information design and as a pioneer in the field of data visualization. Here is his website: http://www.edwardtufte.com/tufte/.
We appreciate his works very much, especially The Visual Display Of Quantitative Information, which we recommend to any developers or designers.
As it says,
Graphical displays should
- show the data
- induce the viewer to think about the substance rather than about methodology, graphic design, the technology of graphic production, or something else
- avoid distorting what the data have to say
- present many numbers in a small space
- make large data sets coherent
- encourage the eye to compare different pieces of data
- reveal the data at several levels of detail, from a broad overview to the fine structure
- serve a reasonably clear purpose: description, exploration, tabulation, or decoration
- be closely integrated with the statistical and verbal descriptions of a data set.
AnyChart is an instrument. We give the opportunity to create many different charts in many different ways, and this powerful instrument should be used correctly.
Speaking of “encouraging the eye to compare different pieces of data”: compare a table and a graphical representation of the famous Anscombe’s Quartet:
Anscombe’s Quartet Table
| I |
II |
III |
IV |
| x |
y |
x |
y |
x |
y |
x |
y |
| 10.0 |
8.04 |
10.0 |
9.14 |
10.0 |
7.46 |
8.0 |
6.58 |
| 8.0 |
6.95 |
8.0 |
8.14 |
8.0 |
6.77 |
8.0 |
5.76 |
| 13.0 |
7.58 |
13.0 |
8.74 |
13.0 |
12.74 |
8.0 |
7.71 |
| 9.0 |
8.81 |
9.0 |
8.77 |
9.0 |
7.11 |
8.0 |
8.84 |
| 11.0 |
8.33 |
11.0 |
9.26 |
11.0 |
7.81 |
8.0 |
8.47 |
| 14.0 |
9.96 |
14.0 |
8.10 |
14.0 |
8.84 |
8.0 |
7.04 |
| 6.0 |
7.24 |
6.0 |
6.13 |
6.0 |
6.08 |
8.0 |
5.25 |
| 4.0 |
4.26 |
4.0 |
3.10 |
4.0 |
5.39 |
19.0 |
12.50 |
| 12.0 |
10.84 |
12.0 |
9.13 |
12.0 |
8.15 |
8.0 |
5.56 |
| 7.0 |
4.82 |
7.0 |
7.26 |
7.0 |
6.42 |
8.0 |
7.91 |
| 5.0 |
5.68 |
5.0 |
4.74 |
5.0 |
5.73 |
8.0 |
6.89 |

As you can see, in this case the graphical representation speaks loudly, whilst the table remains silent.
We will go on posting here some important tips from Edward Tufte’s books, but after all, the most helpful thing is just considering carefully the way to visualize your data.
June 15th, 2011 by Timothy Loginov
Today, we are glad to publish a new success story: Auditr have chosen AnyChart to visualize healthcare data.
Auditr (http://www.auditr.com/) is an online, totally web-based service designed specially for hospitals and healthcare organizations. It helps to provide assurance, get early warning of potential problems, and improve performance. With Auditr, users can collect data, report and discuss the results, develop and monitor action plans. Auditr is developed by Internet Learning Ltd, a company that previously built learning management systems used in the field of healthcare.
The challenge was to visualize time-based and statistical data for reports in the form of line, bar, meters and heatmap charts and to make the charts interactive so that an end-user could proceed to more detailed information by clicking a particular point of a chart.
AnyChart was chosen as a solution – the component allows creating a wide variety of fully configurable charts, and all data is easily set in XML format. Using AnyChart’s interactivity options, actions that should be performed when a user clicks a point on a chart were defined.
Enjoy the full story:
Other stories can be found at: https://www.anychart.com/company/success_stories.php
June 9th, 2011 by Margaret Skomorokh
Charts make people not only understand numbers, but also laugh.
GraphJam is a website showing music and popular culture in funny charts and graphs created by users. These charts can be viewed as a form of modern Internet folklore – signed by nicknames, they are half anonymous, and most witty ones are often reposted by other users in blogs and social networks, which resembles the way folklore spreads.
The fact that charts can be used in such an unexpected and curious way truly inspires us. And it was difficult to stay aside, not trying to apply here AnyChart’s vast capabilities and make some especially interesting items posted at GraphJam even more expressive.
All our charts are fully configurable and nice-looking, so they show the best advantage of any information, including even jokes. One of the many types supported by AnyChart is a 3D Pie Chart, and this is our version of a GraphJam 3D Pie Chart:
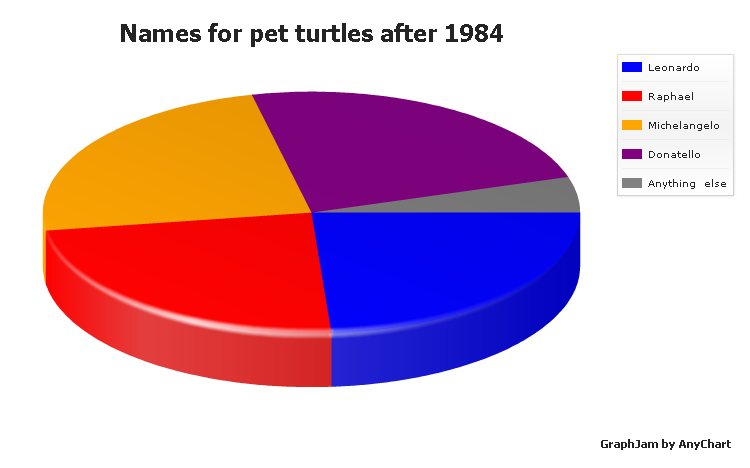
To check out other examples of Pie and Donut Charts, visit our gallery.
We will be posting more charts from GraphJam created by AnyChart.