How to Build Surface Chart Using JavaScript
December 15th, 2021 by Shachee Swadia Data visualization is a must-have skill today with ever-growing data and the need to analyze as well as present that data. You will definitely come across data charts whether you are in the technology industry or not and therefore, it is a good idea to learn how to build visualizations.
I will show you here that building charts is not very tough and with the right tools, you can start creating interactive, interesting visualizations in little time and effort!
In this step-by-step tutorial, I will demonstrate how to represent GDP values of various countries for the past 15 years on a beautiful interactive 3D surface chart using a JavaScript library for data visualization.
The surface plot looks quite complex, but I will show you how straightforward it is to make a compelling and fully functional one.
Read the JS charting tutorial »
- Categories: AnyChart Charting Component, Big Data, HTML5, JavaScript, JavaScript Chart Tutorials, Tips and Tricks
- No Comments »
JavaScript Data Visualization Libraries Updated with New Features — Meet AnyChart JS Charts 8.5.0
December 25th, 2018 by AnyChart Team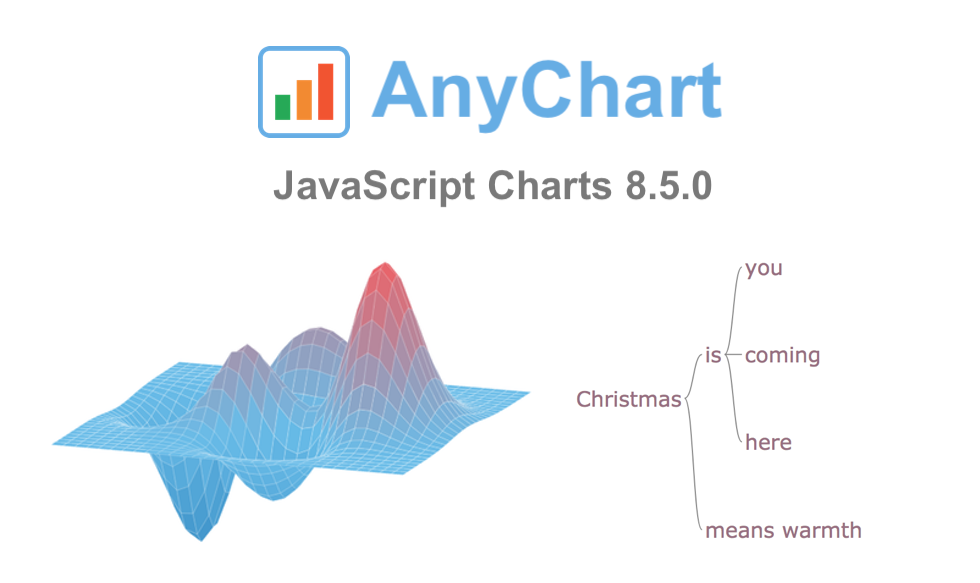 On this wonderful day, we are excited to announce a new major update for our JavaScript data visualization libraries: AnyChart 8.5.0 is released!
The new version brings a lot of advanced features and improvements that make our JS (HTML5) charting solutions even more powerful. 3D Surface Plot, Word Tree, and much more — spare a minute to look through the highlights of the 8.5.0 release of AnyChart, AnyStock, AnyGantt, and AnyMap.
- Categories: AnyChart Charting Component, AnyGantt, AnyMap, AnyStock, HTML5, JavaScript, News
- 1 Comment »