Visualizing Noise, Census, COVID-19, and Happiness Data — DataViz Weekly
September 25th, 2020 by AnyChart Team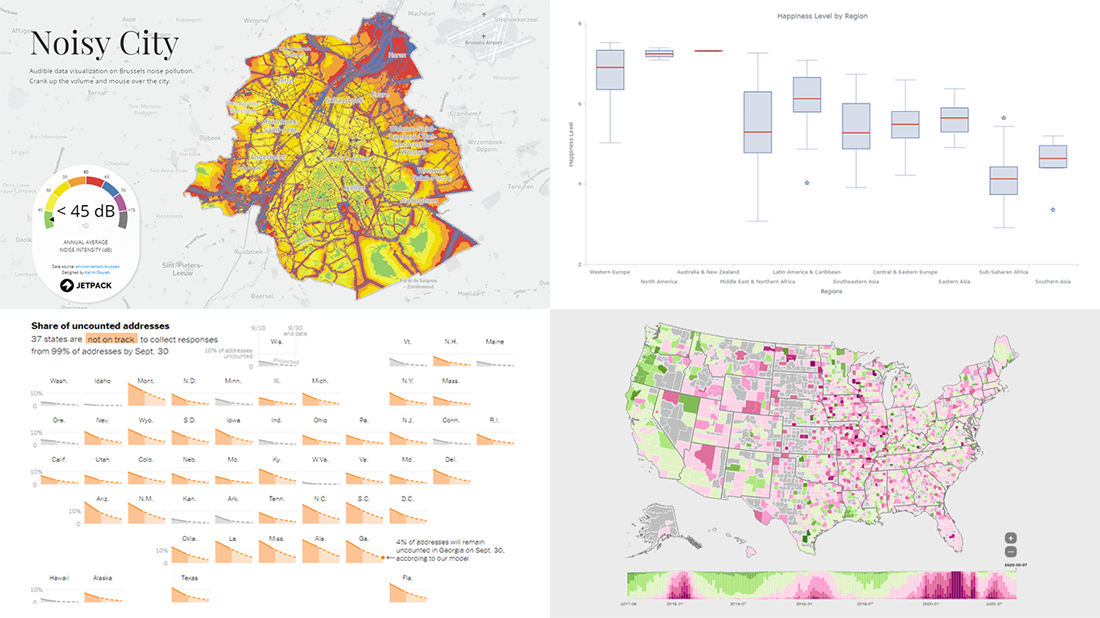 We have put together a roundup of new awesome data visualizations from around the web. Look what we’ve got for you to check out this Friday on DataViz Weekly:
- Noise pollution in Brussels — Karim Douïeb
- Census 2020 undercounts and their consequences — NYT Opinion
- COVID-19 symptoms search trends — Google People + AI Research (PAIR)
- World happiness by region — Wayde Herman
- Categories: Data Visualization Weekly
- No Comments »
New Maps and Charts Showing Power of Data Visualization — DataViz Weekly
September 11th, 2020 by AnyChart Team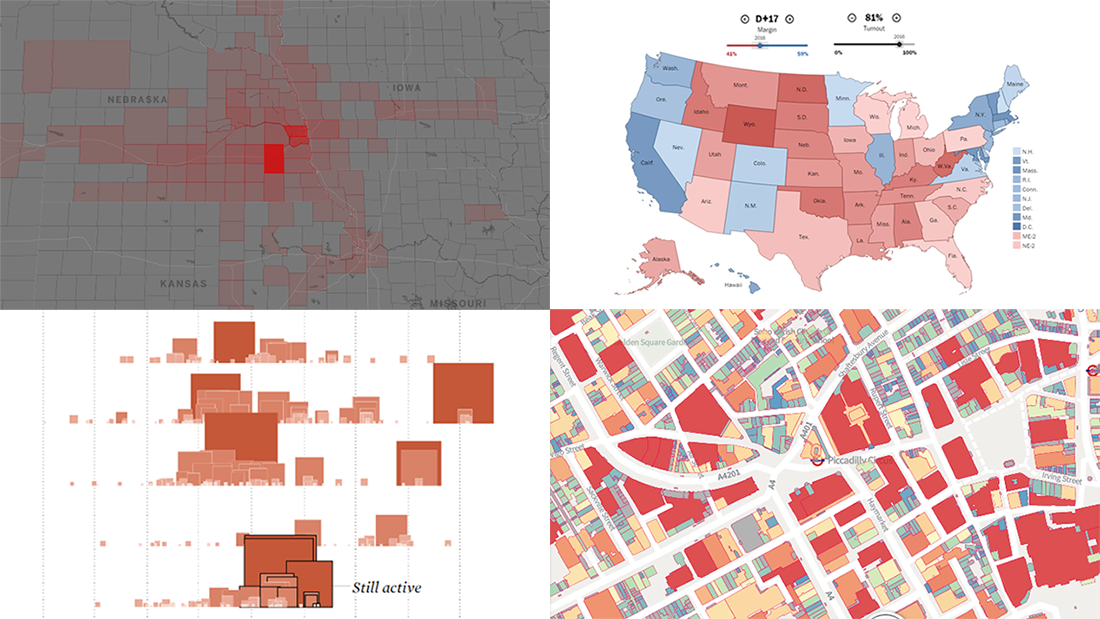 The long wait is over! DataViz Weekly is here bringing some of the best new maps and charts from all over the web to the spotlight! Look at these amazing examples that show the power of smart data visualization:
- College football fan movement and COVID-19 risk — ESPN
- California wildfires over the past 17 years — FlowingData
- London solar opportunities — UCL Energy
- Voter scenarios for the U.S. presidential election — The Washington Post
- Categories: Data Visualization Weekly
- No Comments »
Awesome Fresh Data Visualization Projects for Inspiration — DataViz Weekly
September 4th, 2020 by AnyChart Team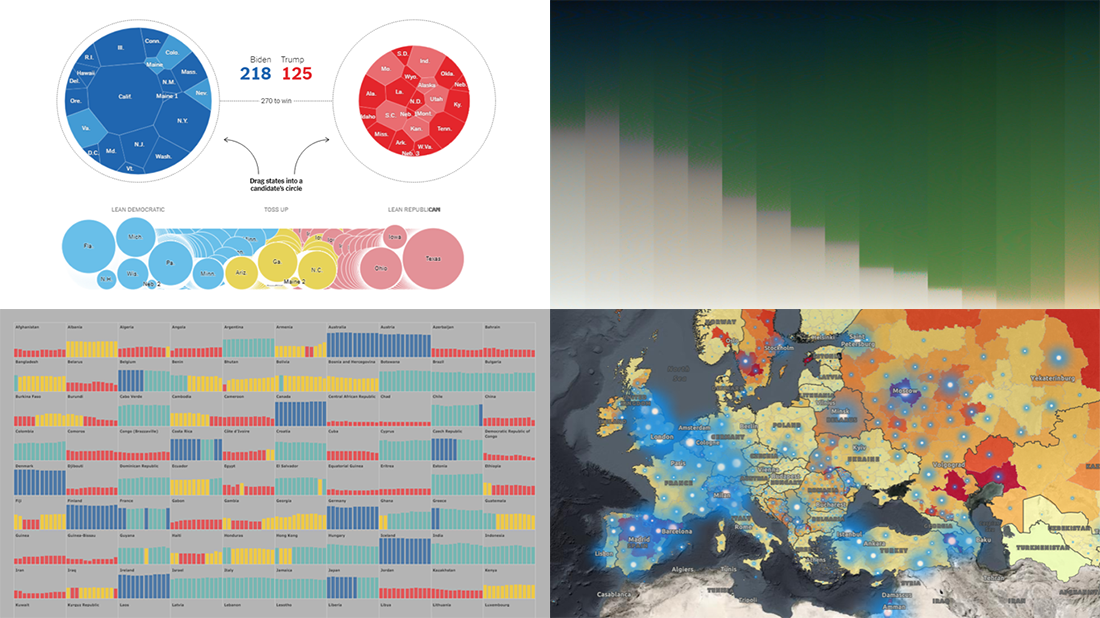 Celebrating the first Friday of September, don’t miss these awesome fresh data visualization projects for inspiration! We have recently met them around the web and are glad to introduce you to them in a quick overview. So our new picks for DataViz Weekly include:
- COVID-19 situation in Europe, a subnational view — WHO/Europe
- Potential outcomes of the U.S. presidential election — The New York Times
- State of democracy worldwide since 2006 — Preity Lodha
- Colors of the American landscape vs electoral map colors — The Upshot
- Categories: Data Visualization Weekly
- 1 Comment »
New Great Charts and Maps for Data Visualization Addicts — DataViz Weekly
August 21st, 2020 by AnyChart Team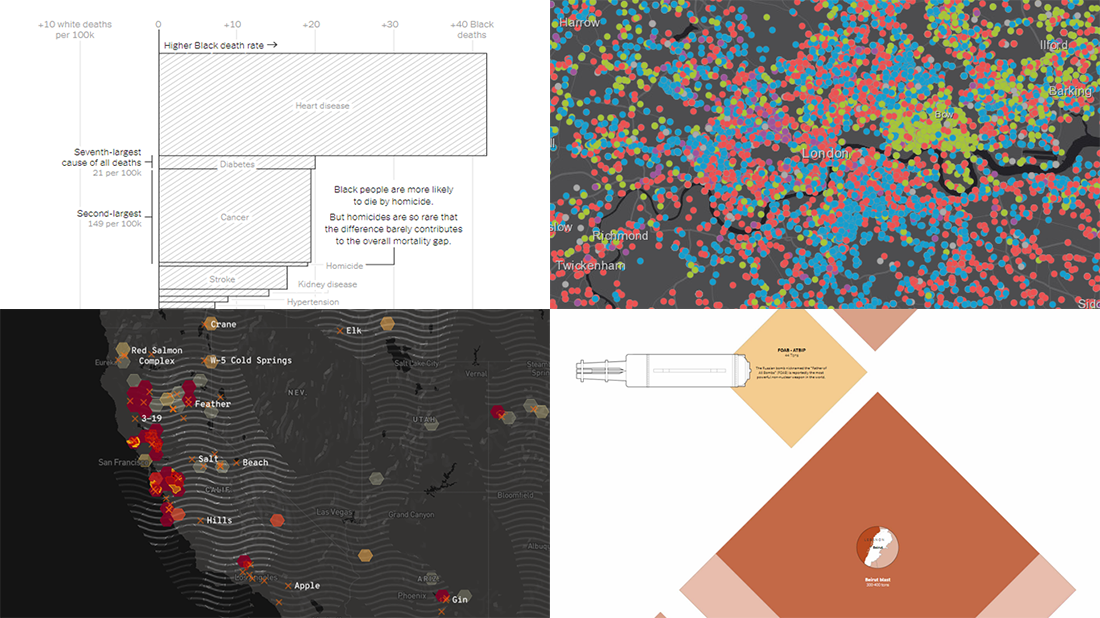 DataViz Weekly is here with a new dose of awesome charts and maps for all data visualization addicts! Today, we are putting a spotlight on the following projects where data is allowed to speak with the help of graphics:
- Stop and search incidents in London — Esri UK Education
- California wildfires — Los Angeles Times
- Scale of the Beirut explosion — Reuters
- Mortality rates for Black and White Americans — New York Times Opinion
- Categories: Data Visualization Weekly
- No Comments »
New Information Visualization Projects Not to Be Missed — DataViz Weekly
August 14th, 2020 by AnyChart Team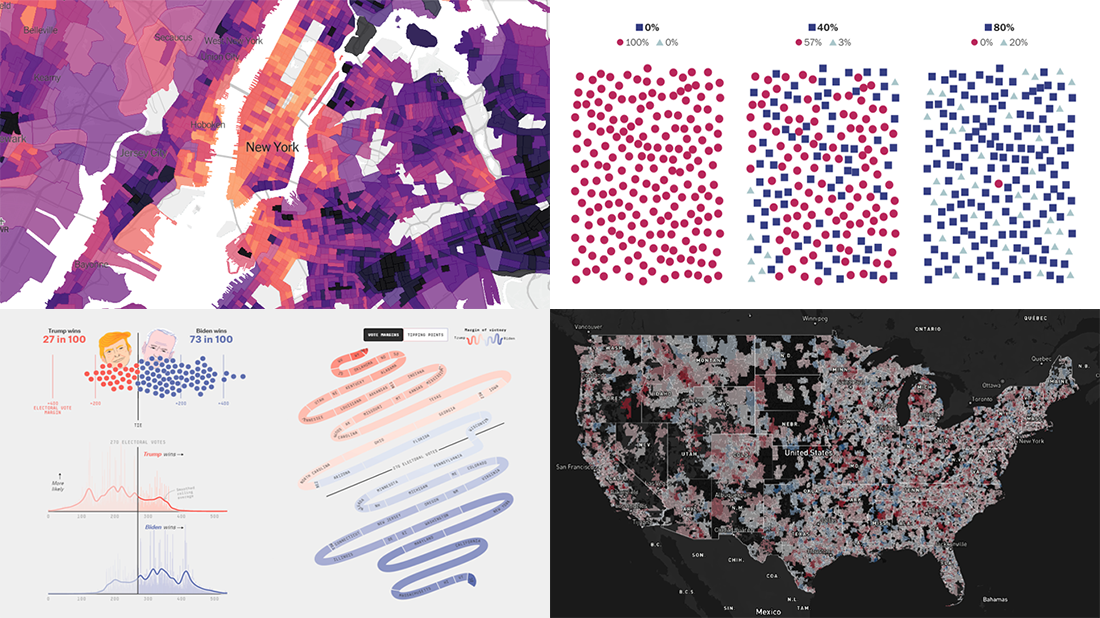 Look at these new cool information visualization projects and notice how different techniques help explore and communicate data, in practice.
Today in DataViz Weekly:
- FiveThirtyEight’s 2020 U.S. presidential election model — FiveThirtyEight
- Herd immunity simulations — The Washington Post
- Unemployment in the United States at the census tract level — The Upshot
- Home prices in America — Realbloc
- Categories: Data Visualization Weekly
- No Comments »
Plotting Data on Park Soundscapes, $600 Unemployment, COVID-19 Deaths, and Game of Thrones Battles — DataViz Weekly
July 31st, 2020 by AnyChart Team There are many ways of plotting data. Which one to choose in your case? The answer depends, of course, on what kind of data you need to analyze and what questions you want it to answer. In DataViz Weekly, we meet you with some of the best practices on a regular basis. The only thing that unites them is, all the highlighted projects have been launched in public just about now. So here are the new great examples and inspirations:
- Changing soundscapes of urban parks worldwide — MIT Senseable City Lab
- Extra $600 unemployment benefits in America — The New York Times
- COVID-19 deaths in Brazil (as if all of them happened in one neighborhood) — Agência Lupa & Google News Initiative
- Game of Thrones battles in a network graph — Wayde Herman
- Categories: Data Visualization Weekly
- No Comments »
Curating New Interesting Data Visualizations Worth Checking Out — DataViz Weekly
July 17th, 2020 by AnyChart Team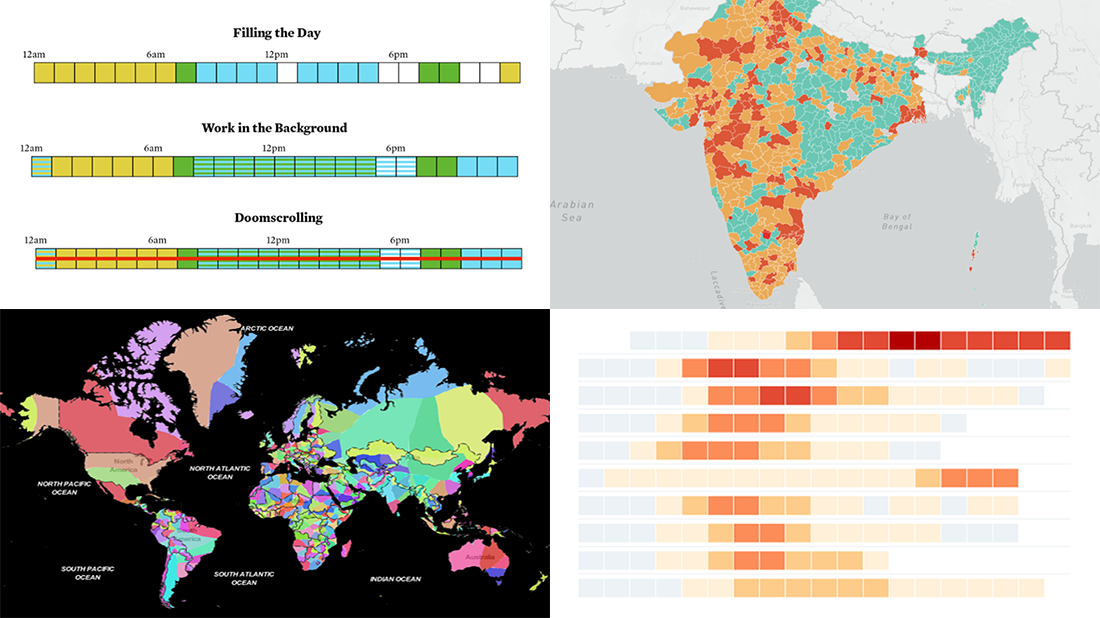 We continue to curate new interesting data visualizations from around the web for our DataViz Weekly blog. Join us as we look at some of the best charts and maps we have seen these days!
- Parenting and Working During Lockdown — Nathan Yau
- Nearest Neighboring Countries — Topi Tjukanov
- Excess Deaths Worldwide — The Economist
- Reopening India from Lockdown — Development Seed and Mapbox
- Categories: Data Visualization Weekly
- No Comments »
New Cool Graphics From Around the Web — DataViz Weekly
July 10th, 2020 by AnyChart Team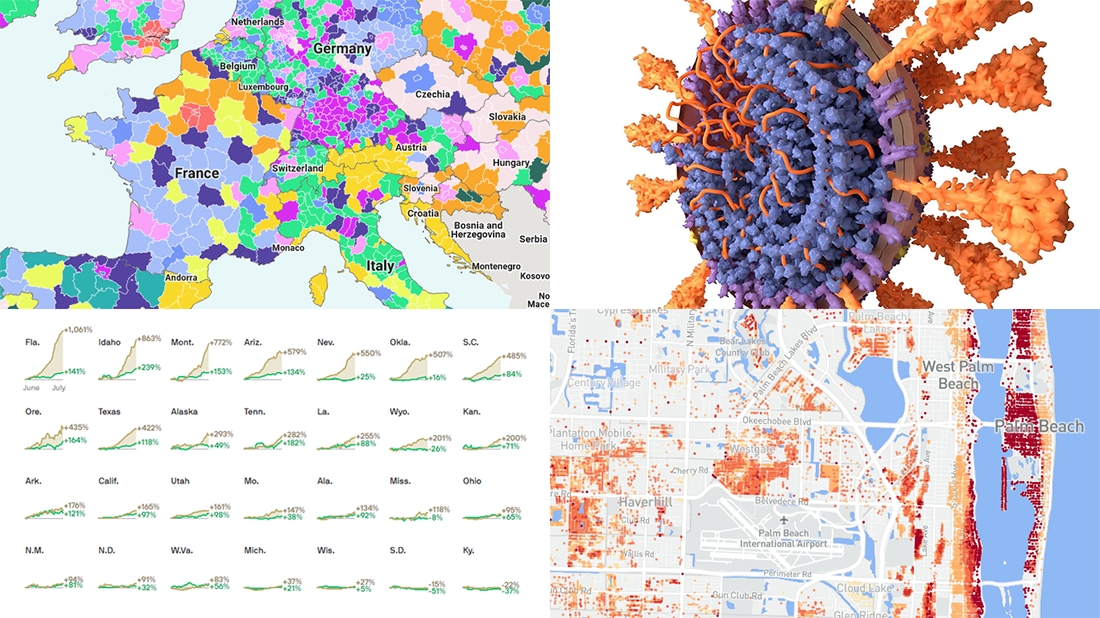 It’s Friday and we’re glad to share with you some of the most interesting third-party visualizations we’ve recently come across. Here’s what DataViz Weekly has for you to check out this time — look at these cool graphics:
- Future of jobs in the regions of Europe — McKinsey Global Institute, Google, et al.
- Flood risk factor database for the United States — First Street Foundation, et al.
- Changes in new cases against testing — Axios
- All we know about SARS-CoV-2 — Scientific American
- Categories: Data Visualization Weekly
- 1 Comment »
Information Visualization Techniques in Action on Democracy, Covid-19, Inequality & Gerrymandering — DataViz Weekly
June 26th, 2020 by AnyChart Team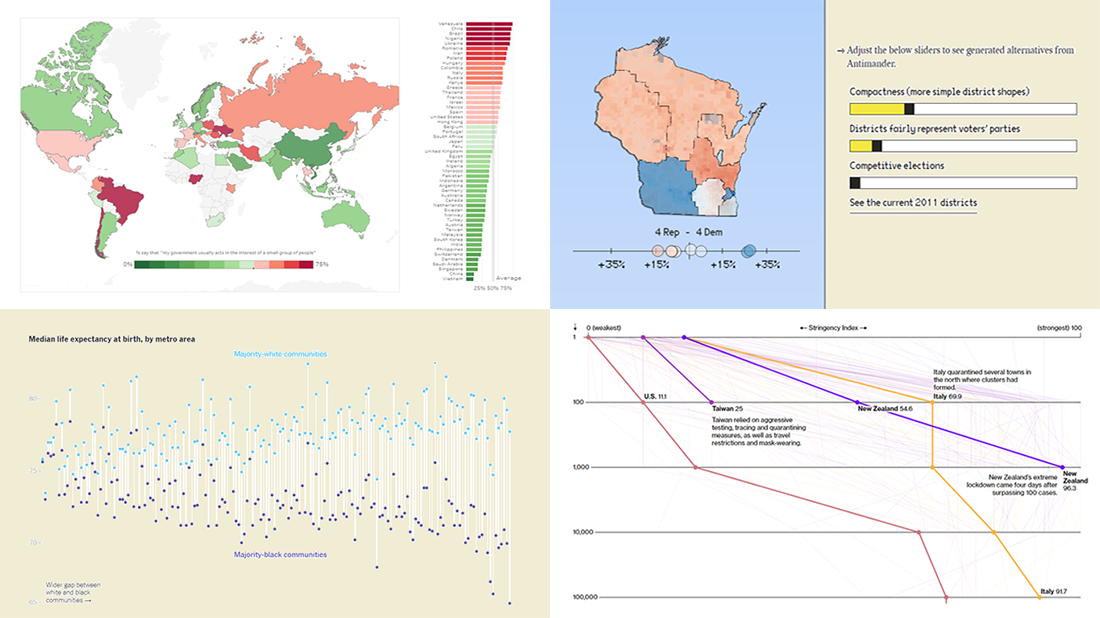 DataViz Weekly is here exhibiting new interesting projects from around the web that demonstrate a great use of different information visualization techniques to deliver better insight. See our new picks:
- Democracy Perception Index 2020 — Dalia
- Government reactions to the Covid-19 pandemic — Bloomberg News
- Gaps between Black and White America — The New York Times Opinion
- Antimander, a tool to expose gerrymandering in congressional districts — Joel Simon
- Categories: Data Visualization Weekly
- No Comments »
Visualizing COVID-19 Pandemic Data for Austria Using AnyChart JS Charts
June 25th, 2020 by AnyChart Team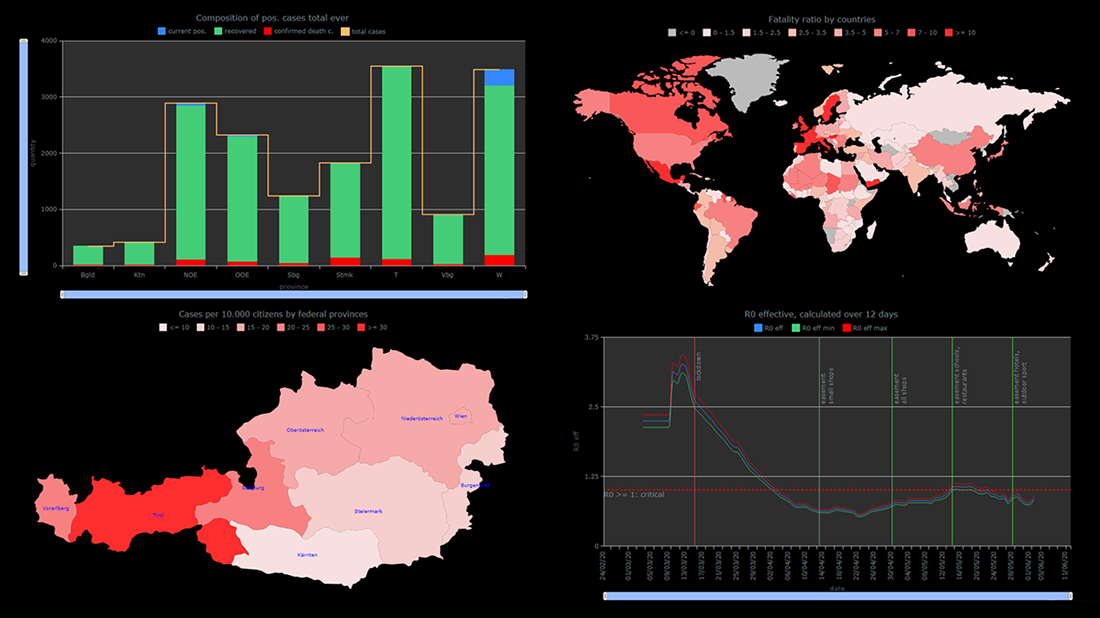 The COVID-19 pandemic persists as a global emergency, and we continue to support initiatives that contribute to tackling the coronavirus crisis. Specifically, we allow COVID-19 analytics projects to use our data visualization tools for free under a non-profit license.
You already know about StopCorona, a COVID tracker by Diffco, which is one such resource. Today, we want to meet you with another noteworthy project using AnyChart to visualize the pandemic statistics — iConcepts SARS-CoV-2 Stats. Created by Austrian part-time web developer Juergen Hoefer and featured on the official Open Data Austria portal, it shows the COVID-19 statistics for Austria (and worldwide) from different perspectives, in countless interactive charts powered by our JavaScript (HTML5) charting library.
We asked Juergen a few questions to learn more about this project and his experience visualizing COVID-19 pandemic data with the help of AnyChart. Read the answers and take a glance at several quick chart examples from his website. (Stack: HTML/CSV.)
- Categories: AnyChart Charting Component, AnyMap, Big Data, HTML5, Success Stories
- 1 Comment »