Map Visualizations About US Violence, UK Real Estate, Brazil Streets, and Berliners — DataViz Weekly
August 31st, 2018 by AnyChart Team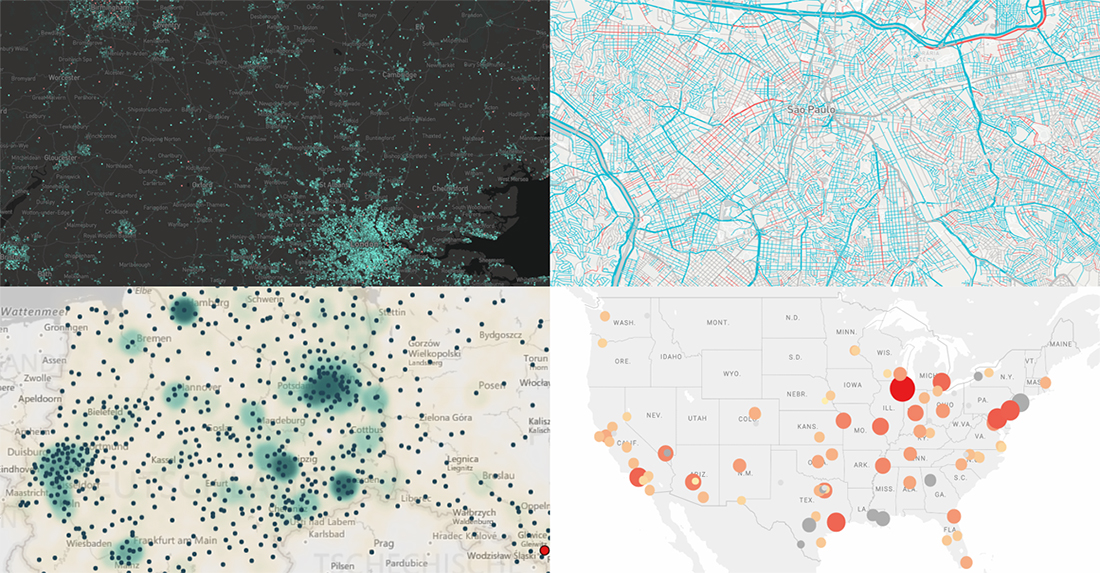 Hey everyone. This week, we’ve come across four interesting map visualizations and decided to share them with you within the framework of our DataViz Weekly feature. Let’s start with a quick list of what projects are featured and then, without more ado, take a look at them more closely right away:
- gender of all streets in Brazil;
- birthplaces of current Berliners;
- house price change in England and Wales;
- violent crime trends in the USA.
- Categories: Data Visualization Weekly
- No Comments »
Data Visualization Projects About Construction, PMI Activity, Climate, and Election — DataViz Weekly
August 24th, 2018 by AnyChart Team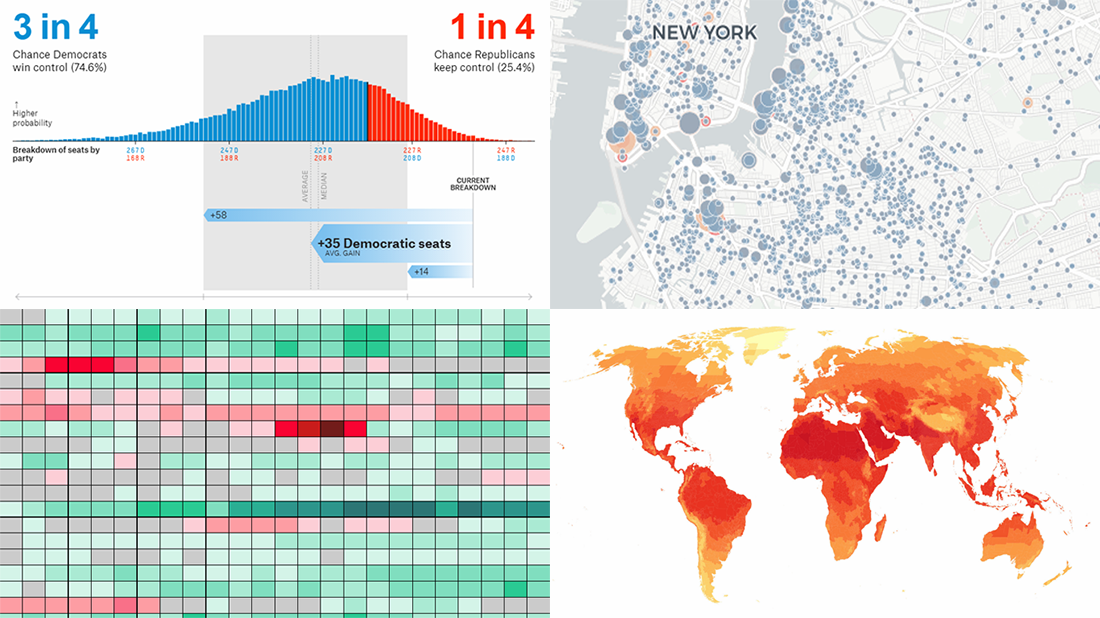 Welcome to DataViz Weekly, a regular feature on the AnyChart blog that highlights some of the most interesting new data visualization projects each Friday.
Here’s what we are glad to tell you about this time:
- active constructions in New York City, in real time;
- global PMI activity;
- cities with no need for air conditioning and heating;
- 2018 U.S. House midterm election forecast.
- Categories: Data Visualization Weekly
- No Comments »
California Wildfire in Maps and Charts — DataViz Weekly
August 17th, 2018 by AnyChart Team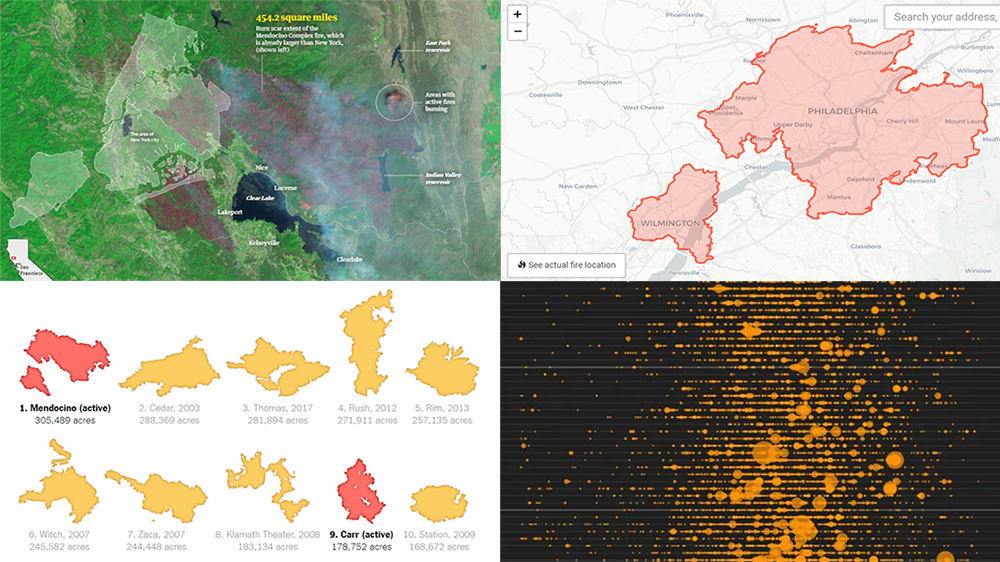 A new record-breaking wildfire season in California is in full swing, occupying the headlines of many national and even world media outlets. To better analyze and present what’s going on, data and graphics experts created various maps and charts. Today’s issue of Data Visualization Weekly features some interesting ones of them, and in fact, is fully dedicated to the topical California wildfire problem.
- Categories: Data Visualization Weekly
- 1 Comment »
New Cool DataViz Works about Democracy, Floor Plan, Music, and Economy — DataViz Weekly
August 10th, 2018 by AnyChart Team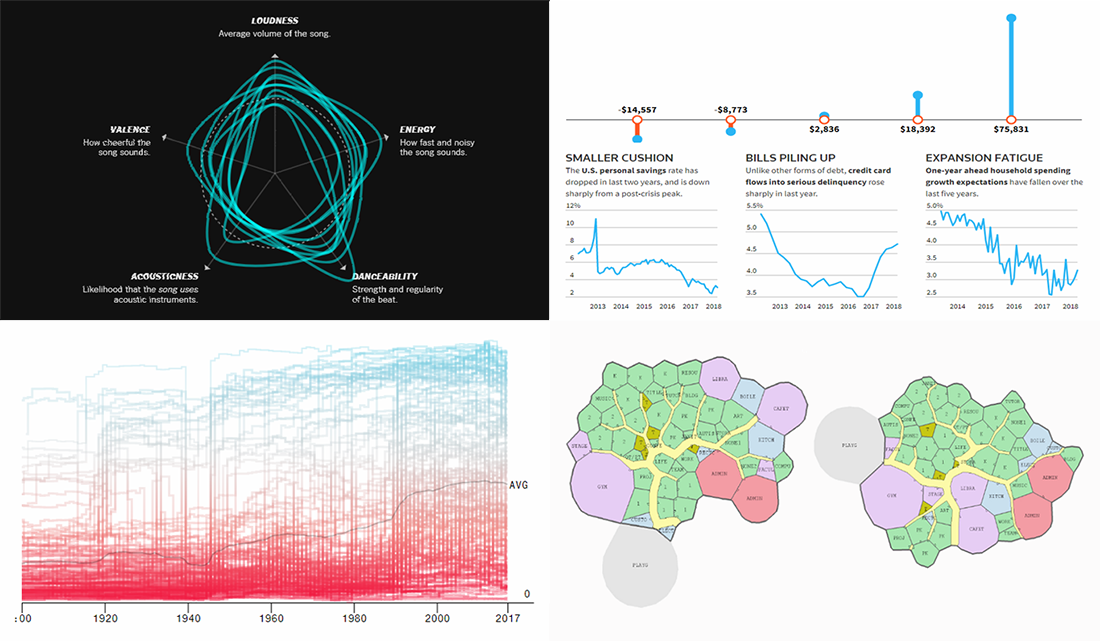 Another seven-day-long wait is over, and finally, the new DataViz Weekly piece is now out. So if you want to check out some of the new cool dataviz works we’ve recently found out there on the web, look no further!
Today on Data Visualization Weekly:
- more elections but less democracy;
- floor plan optimization based on genetic algorithms;
- similarity of music hits;
- poorer Americans and U.S. economy growth.
- Categories: Data Visualization Weekly
- No Comments »
Interesting Data Visuals About Land, Companies, Education, and Programming — DataViz Weekly
August 3rd, 2018 by AnyChart Team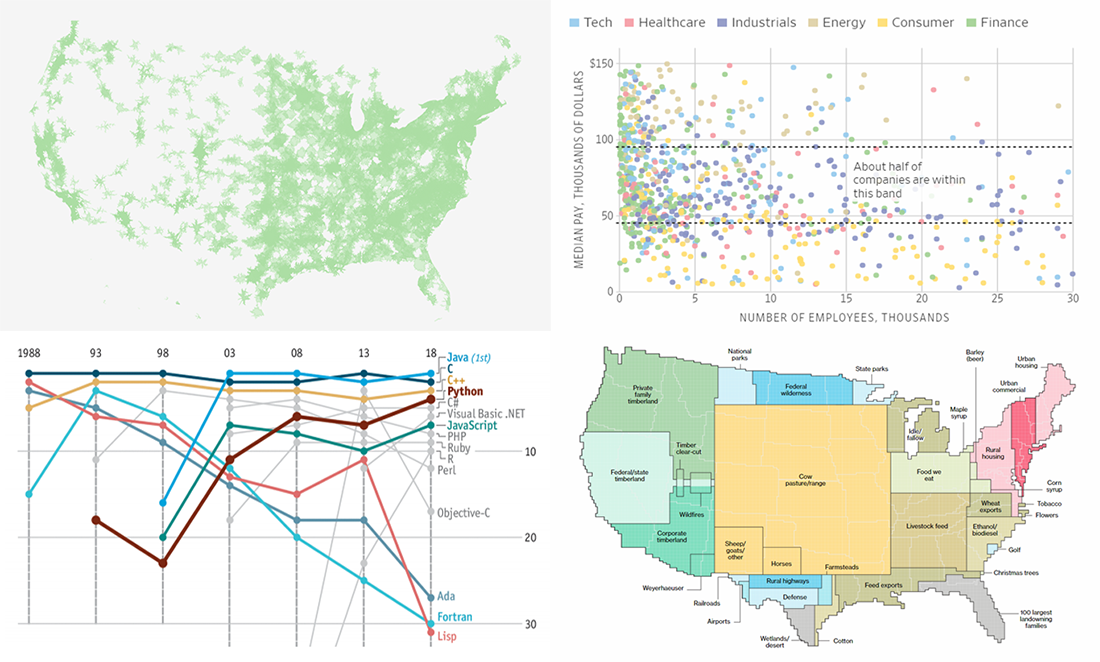 DataViz Weekly is here to meet you with several new interesting data visuals and stories based on them that have come to light just recently. Look what we are happy to feature this time:
- how the United States uses its land;
- company size vs. pay;
- education deserts in America;
- popularity of programming languages.
- Categories: Data Visualization Weekly
- 1 Comment »
Visualizations About Election, Jobs, Stars, and Being Young — DataViz Weekly
July 27th, 2018 by AnyChart Team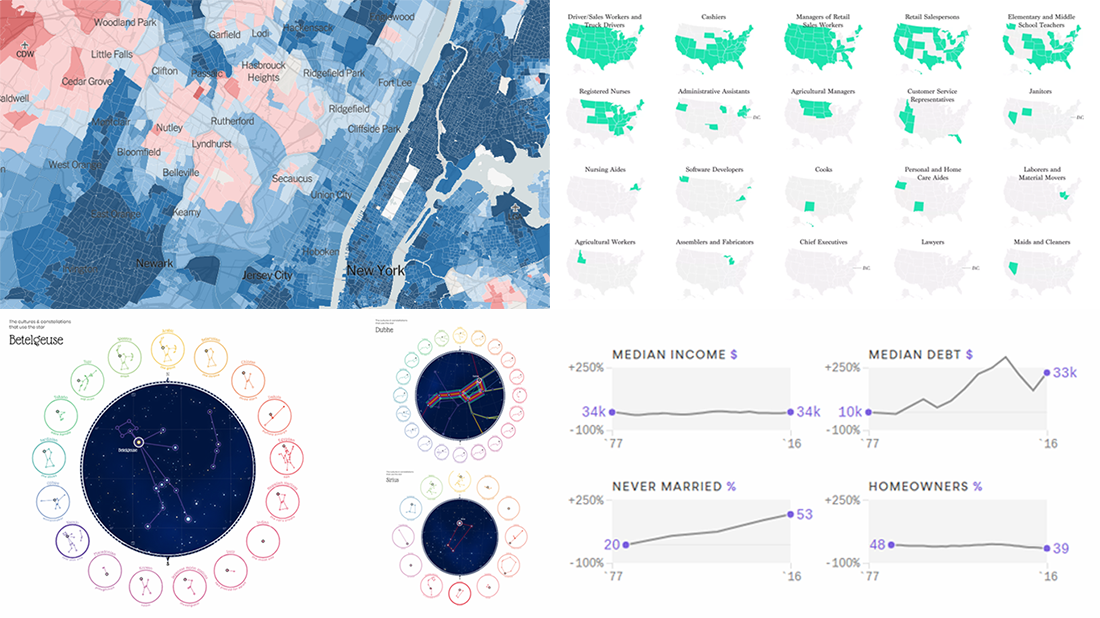 It’s already Friday, so don’t hesitate to check out the new DataViz Weekly post on our blog. Here you’ll find visualizations about:
- 2016 U.S. presidential election, by voting precinct;
- the most popular jobs in the United States, by state;
- what’s changed in the life of young American adults in 1977-2016;
- different constellations seen by different cultures in the same sky.
- Categories: Data Visualization Weekly
- No Comments »
Information Graphic Works About Street Orientation, Earnings, Birth Control, and Car Output — DataViz Weekly
July 20th, 2018 by AnyChart Team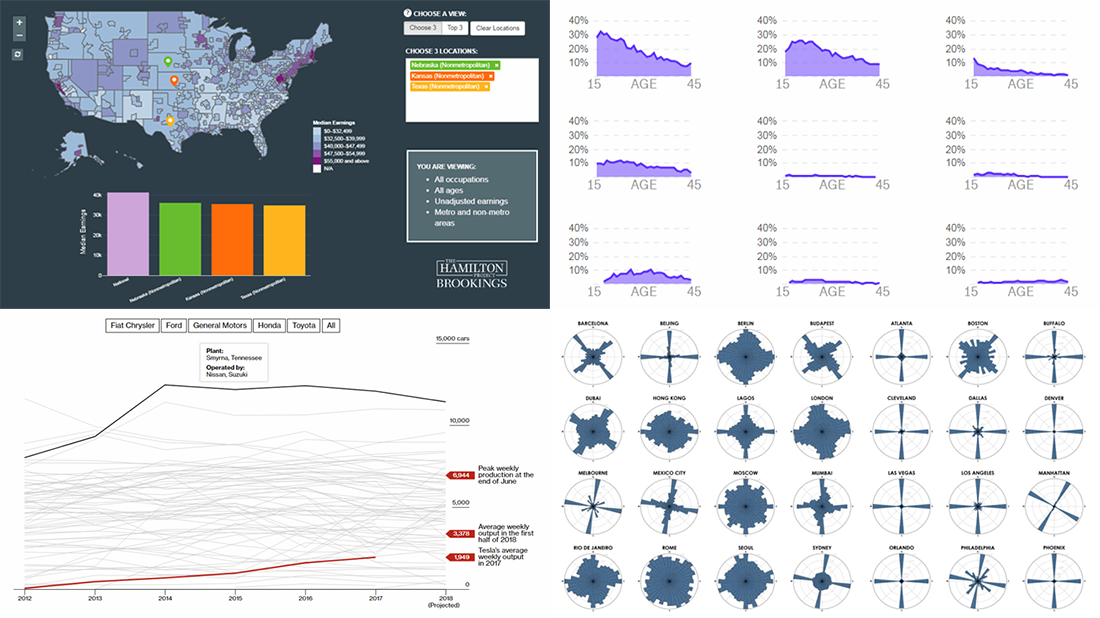 Not only is the AnyChart JS Charts blog a go-to place for our news and tips and tutorials. It’s also where — within the framework of our regular DataViz Weekly feature — we keep you posted on new interesting data visualizations from out there on the web. Today, we’ve chosen to highlight the following information graphic works:
- street orientation in cities around the world;
- occupations and earnings across the United States;
- birth control methods;
- car output of Tesla against North America’s most productive factories.
- Categories: Data Visualization Weekly
- 1 Comment »
Visualizing Recurring Patterns in Data, Area Deprivation Index, Corporate Debt, and Childhood Obesity — DataViz Weekly
July 13th, 2018 by AnyChart Team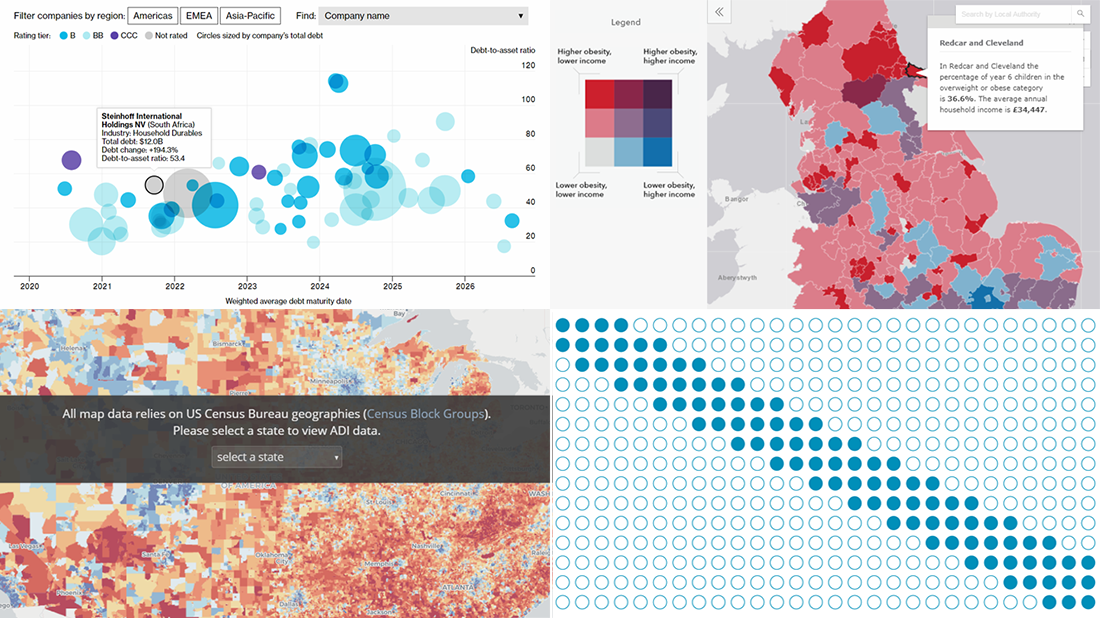 Visualizing recurring patterns that may be recognized in data, socio-economic deprivation neighborhood by neighborhood across the United States, the global corporate debt issue, and England’s childhood obesity — these topics are in the focus of the new DataViz Weekly digest that we are glad to present right now.
- Categories: Data Visualization Weekly
- No Comments »
Data Graphics About Batteries, Trump, Environment, and Soccer — DataViz Weekly
July 6th, 2018 by AnyChart Team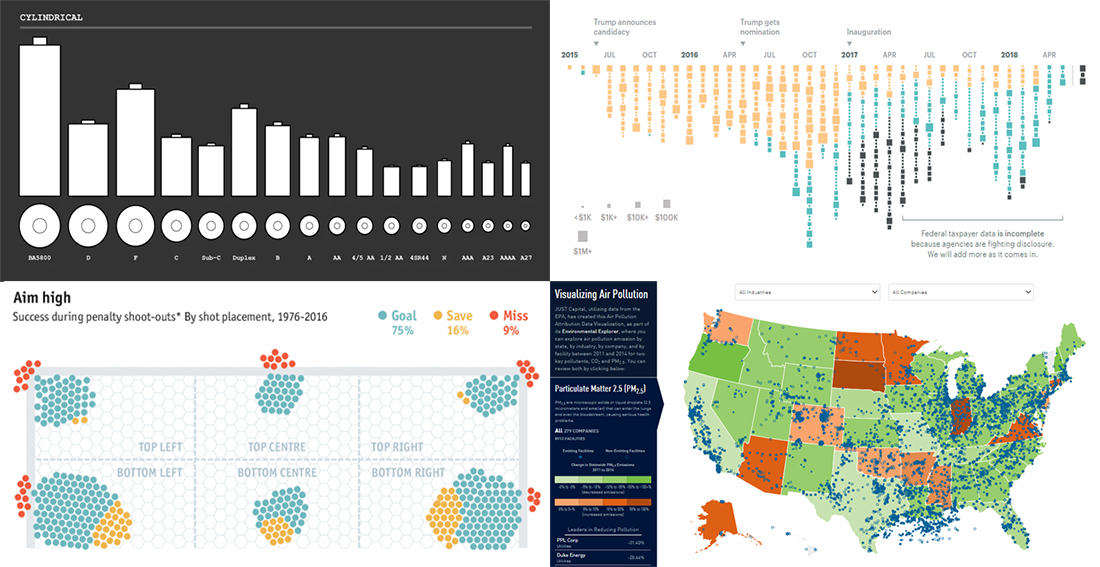 Hello Friday! DataViz Weekly is here to entertain you with several new interesting data graphics we’ve recently come across.
Here’s a quick list of what visualizations we are glad to draw your attention to this time, to start with:
- all battery sizes;
- political and government spendings at Donald Trump’s properties from 2015 to 2018;
- Environmental Explorer;
- FIFA World Cup and UEFA Euro penalty shoot-outs.
- Categories: Data Visualization Weekly
- No Comments »
FIFA World Cup, Mario Kart, and Global Economic Indicators — DataViz Weekly
June 29th, 2018 by AnyChart Team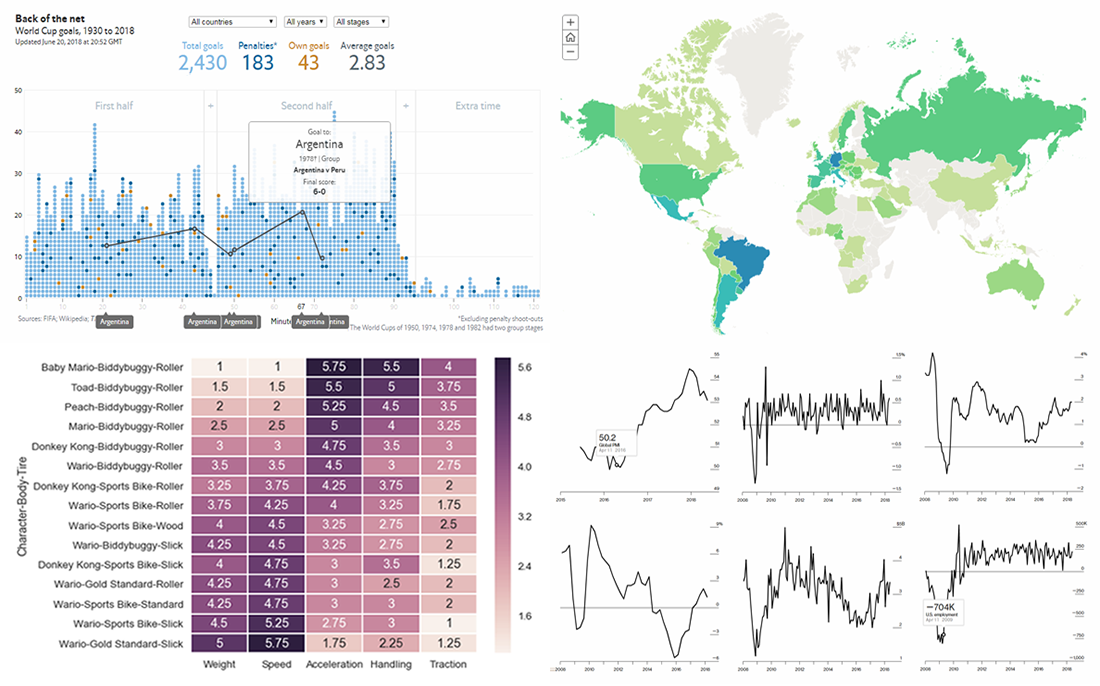 The 21st FIFA World Cup in Russia attracts the attention of many millions around the world who have been thoroughly watching the matches, and the tournament is about to enter the playoff stage. Today’s DataViz Weekly post on our blog will tell you about two cool data visualization works devoted to this competition and its history:
- all (more than 2,400) World Cup goals in one chart, and
- thirty-three maps about the World Cup.
In addition, new DataViz Weekly features the following interesting graphics:
- finding the best characters in Mario Kart, and
- 12 key global economic indicators.
- Categories: Data Visualization Weekly
- No Comments »