Effective Visualizations of Information on Pandemic, Climate, Happiness, Travel Time — DataViz Weekly
July 30th, 2021 by AnyChart Team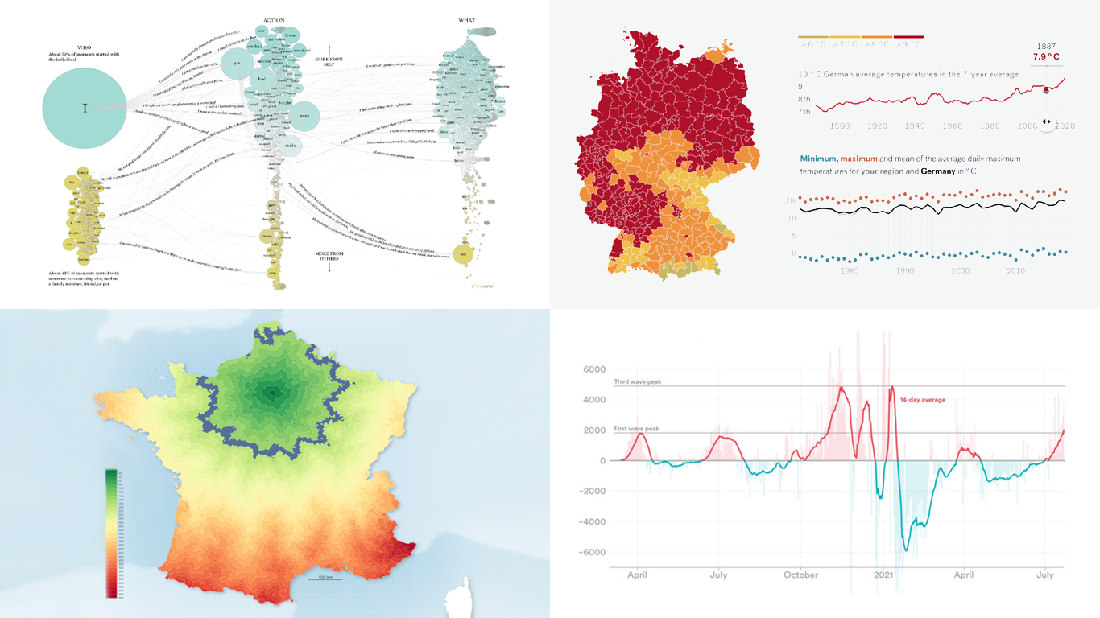 Data becomes easier to perceive and draw insights from when it is properly represented in charts and maps. For everyone interested to check out how information visualization works, we continue our regular feature DataViz Weekly curating the best new examples of effective graphics. Here are our latest picks:
- COVID-19 case acceleration rates — STAT
- Climate change risks across Germany — Vislab
- What makes people happy the most — Nathan Yau
- Driving time to Paris from across France — Nicolas Lambert
- Categories: Data Visualization Weekly
- No Comments »
New Fascinating Visualizations to Explore on Weekend — DataViz Weekly
June 11th, 2021 by AnyChart Team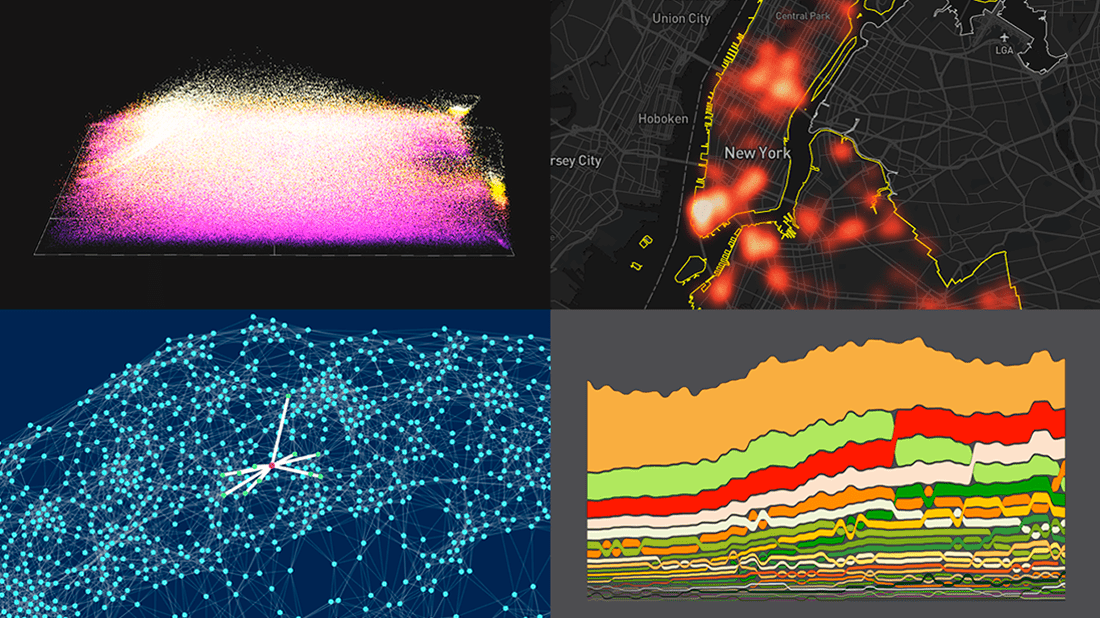 DataViz Weekly is here with a new dose of fascinating data graphics for visualization addicts! Check out some of the most interesting recent projects right away!
- Changes in the American diet over the past 40 years — Nathan Yau
- Surveillance cameras in New York City — Amnesty International
- Cities with similar street networks — Andrei Kashcha
- A million soccer passes visualized at once — Karim Douïeb
- Categories: Data Visualization Weekly
- No Comments »
Fresh Cool Data Graphics for Fun and Inspiration — DataViz Weekly
May 28th, 2021 by AnyChart Team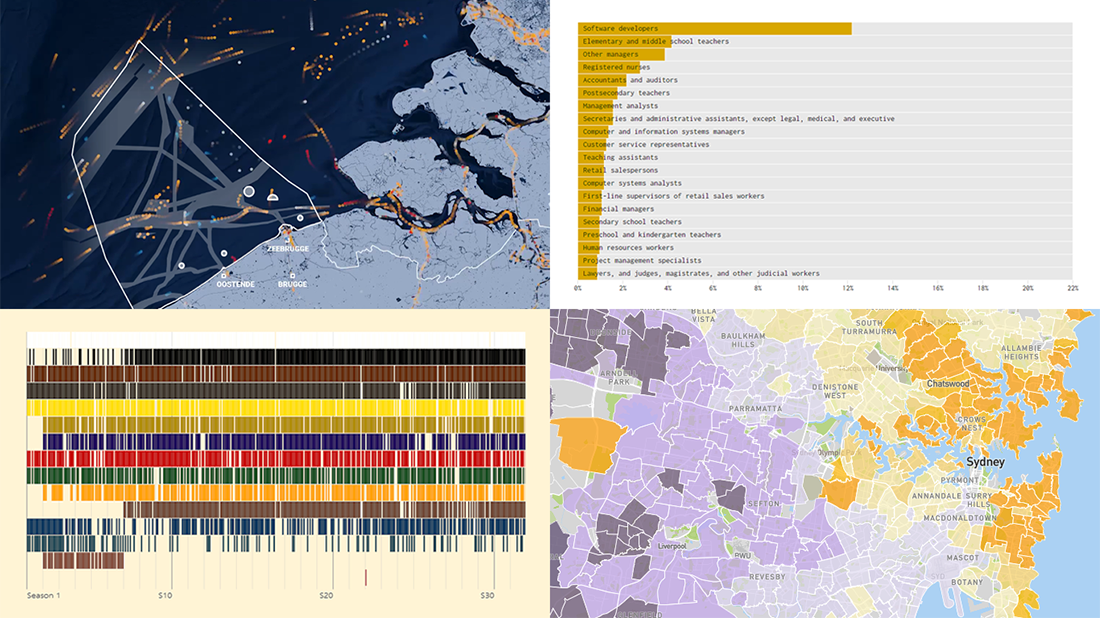 Hey guys, check out new awesome graphics! We have come across these works just about now and decided to highlight them today in DataViz Weekly as really cool data visualization examples. See them now for fun and inspiration!
- Human activity in the Belgian part of the North Sea — De Tijd
- Colors of Bob Ross’s TV artwork — Connor Rothschild
- Housing affordability in Australia — Aussie
- Jobs that tend to marry together — Nathan Yau
- Categories: Data Visualization Weekly
- No Comments »
New Stunning Charts and Maps in Weekly Roundup — DataViz Weekly
April 30th, 2021 by AnyChart Team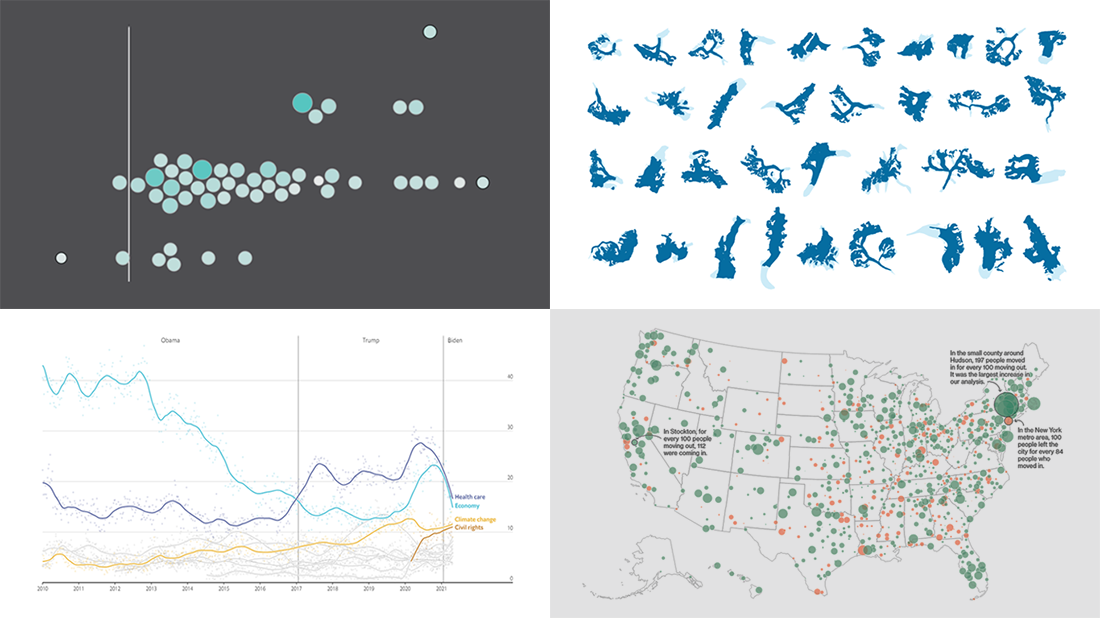 Continuing the series of weekly data visualization roundups, we’re glad to introduce you to our selection of new awesome charts and maps from around the web. Check out our latest picks!
- 2020 U.S. Census results — Nathan Yau
- American public opinion — The Economist
- Migration within the U.S. during the pandemic — Bloomberg CityLab
- Melting glaciers — The Guardian
- Categories: Data Visualization Weekly
- No Comments »
Fresh Compelling Data Graphics Worth Seeing — DataViz Weekly
March 26th, 2021 by AnyChart Team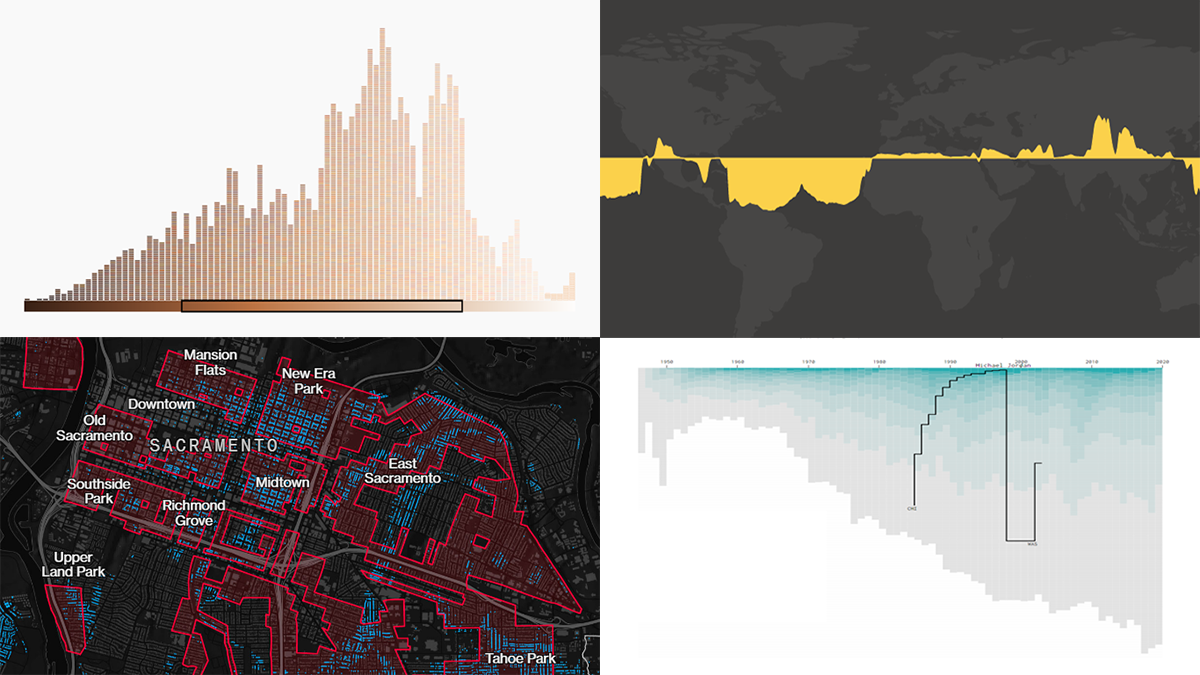 Get your weekly dose of cool data visualization stuff! We have come across these four new amazing projects just lately and are glad to tell you about them right now. Here are the graphics featured this time on DataViz Weekly:
- Career timelines for all NBA players since 1946 — Nathan Yau
- Bias and anti-blackness in the names of foundation shades — The Pudding
- Flood risk in historically redlined and non-redlined neighborhoods — Bloomberg CityLab
- Elevation and bathymetry worldwide along parallels — Nicolas Lambert
- Categories: Data Visualization Weekly
- No Comments »
Four New Robust Visualizations to Check Out on Weekend — DataViz Weekly
March 5th, 2021 by AnyChart Team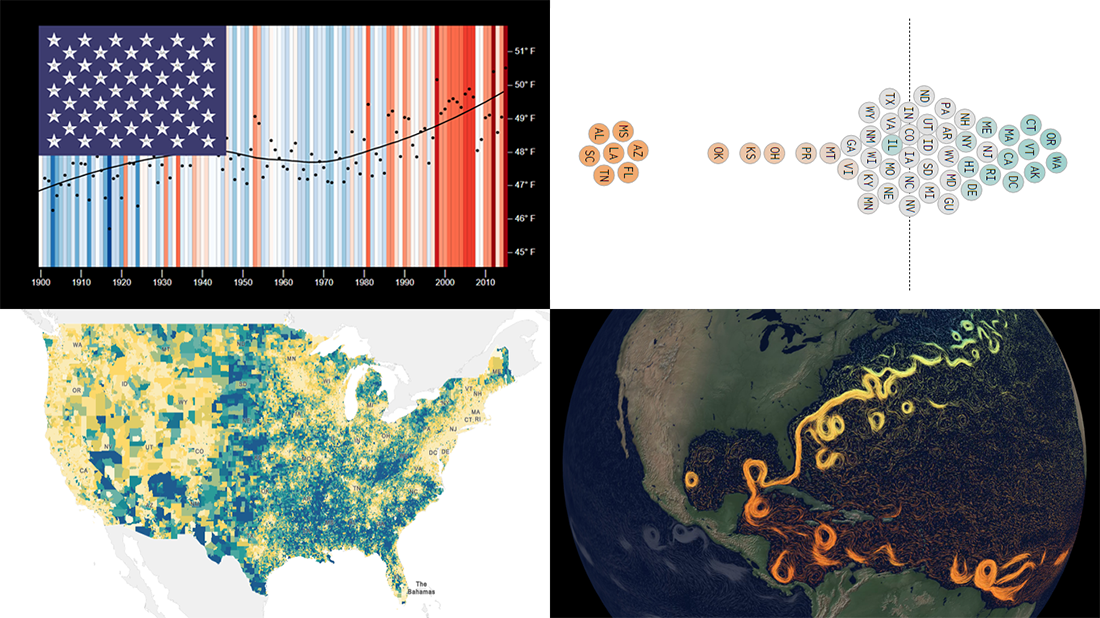 This week, we’ve found a number of new cool projects that could serve as good examples of robust data visualization. Here are the four ones we like the most. Watch how compelling charts and maps let data speak — join us as we overview these projects today on DataViz Weekly:
- Climate stripes for each U.S. state — Luke Browne, YSE
- Causes and dangers of the Gulf Stream weakening — The New York Times
- Minimum wage change in the U.S. by state since 1968 — Nathan Yau
- Homes worth <$100,000 and >$1,000,000 in the U.S. — Social Explorer
- Categories: Data Visualization Weekly
- No Comments »
Best Data Visualizations of 2020 — DataViz Weekly
January 8th, 2021 by AnyChart Team Each week throughout the 2020 year, we curated the most interesting data visualizations from around the Web and introduced them to you in the DataViz Weekly roundup. Now is the time to look at the best of the best! We will hand you over to distinguished experts — Nathan Yau, Alli Torban, Lea Pica, Kenneth Field, and the GIJN team — who have already made their (brilliant) choices. Meet their picks for the best data visualizations of 2020!
- Categories: Data Visualization Weekly
- 1 Comment »
New Graphics That Make Data Talk — DataViz Weekly
December 18th, 2020 by AnyChart Team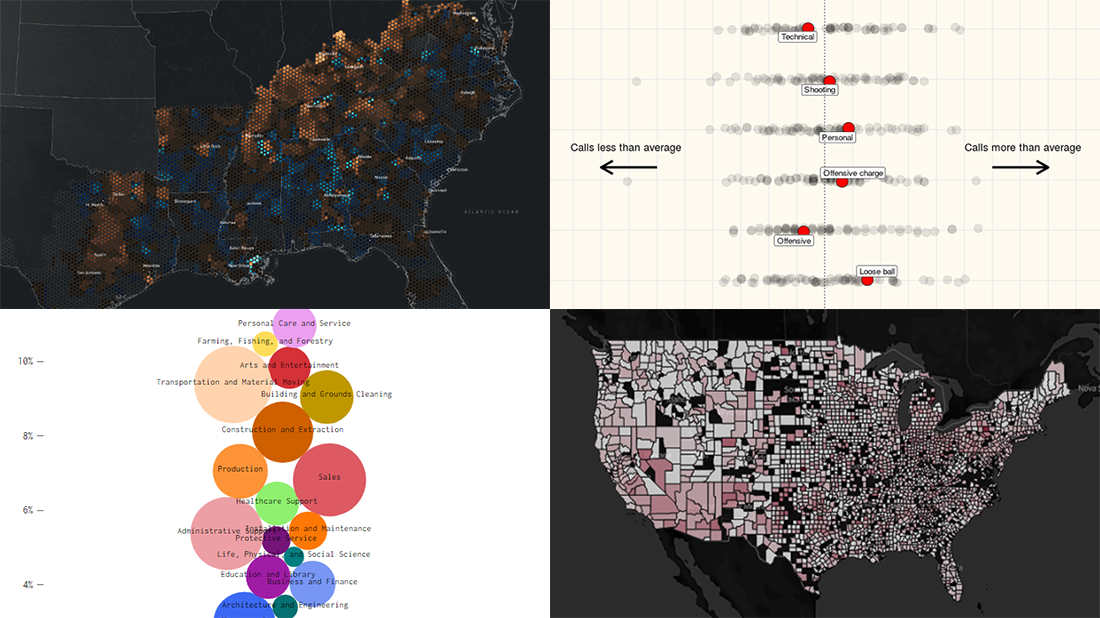 Get ready for another dose of amazing charts and maps! DataViz Weekly‘s here to show you a set of new projects featuring graphics that make data talk — excellent examples of data visualization in action!
Here are this week’s picks:
- Over 200 years of migrations in the American South — Edward Ayers, Nathaniel Ayers & Justin Madron
- NBA fouls and violations, by referee — Owen Phillips
- U.S. unemployment change, by occupation — Nathan Yau
- U.S. hospital COVID-19 bed occupancy — Carlson School of Management at UMN
- Categories: Data Visualization Weekly
- No Comments »
Fresh Great Data Visualization Projects on Thanksgiving, COVID, and Tree Equity — DataViz Weekly
December 4th, 2020 by AnyChart Team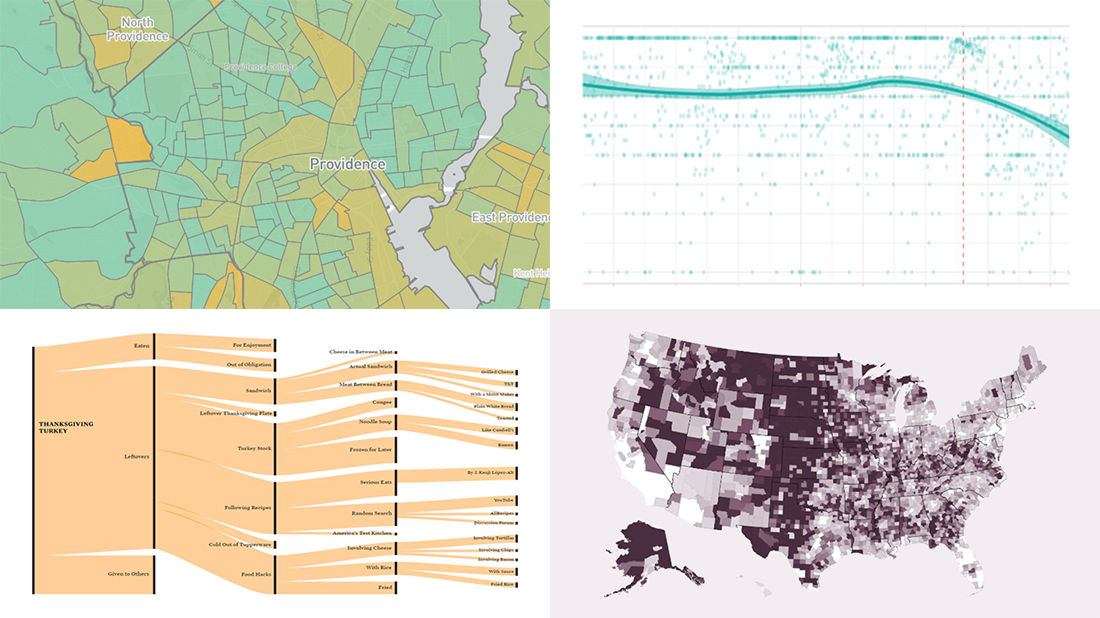 Hey everyone! Continuing to curate the best charts, maps, and infographics from around the Internet, we invite you to meet four fresh great data visualization projects worth checking out.
Today on DataViz Weekly:
- Visualizing the ways the Thanksgiving turkey leftovers were used — Nathan Yau
- Understanding the scale of 250,000 deaths from the coronavirus — The Washington Post
- Finding a correlation between scented candle reviews on Amazon and COVID-19 — Kate Petrova
- Evaluating tree equity in American city neighborhoods — American Forests
- Categories: Data Visualization Weekly
- No Comments »
New Maps and Charts Showing Power of Data Visualization — DataViz Weekly
September 11th, 2020 by AnyChart Team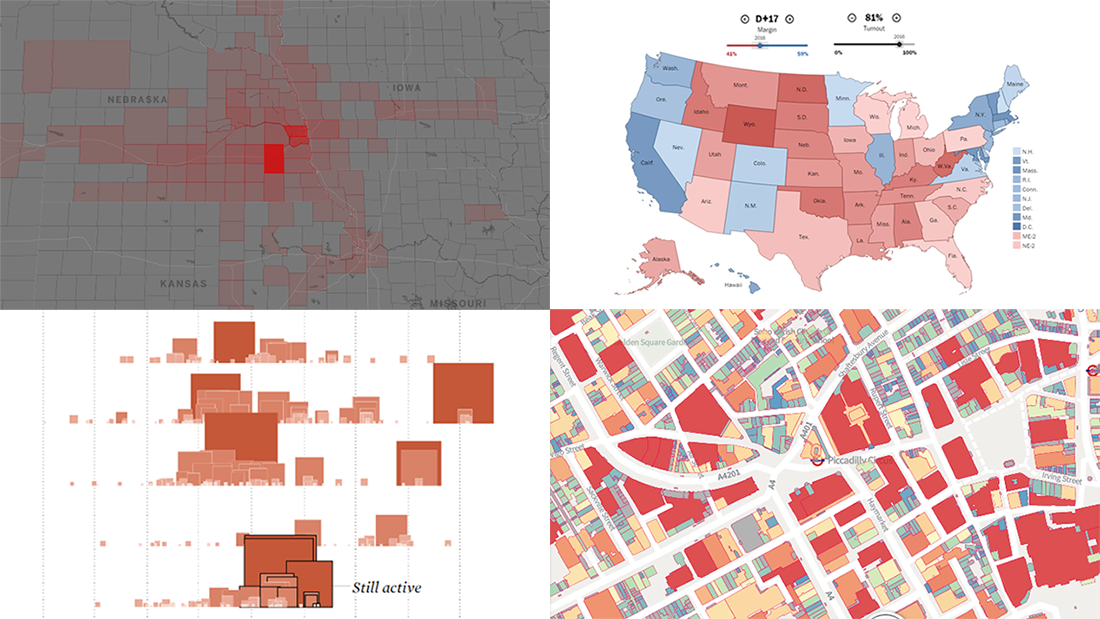 The long wait is over! DataViz Weekly is here bringing some of the best new maps and charts from all over the web to the spotlight! Look at these amazing examples that show the power of smart data visualization:
- College football fan movement and COVID-19 risk — ESPN
- California wildfires over the past 17 years — FlowingData
- London solar opportunities — UCL Energy
- Voter scenarios for the U.S. presidential election — The Washington Post
- Categories: Data Visualization Weekly
- No Comments »