FinancesOnline Honors AnyChart Data Visualization Software with Premium Usability and Rising Star Awards
April 23rd, 2019 by AnyChart Team At AnyChart, we believe that companies and organizations should be able to leverage their data without having to waste time on trying to make sense of raw digits and vast spreadsheets. This is why we worked hard to create a no-fuss interactive data visualization software that does not compromise flexibility while giving everyone a unique chance to visualize any data in any way they want and make correct data-driven decisions they need in an instant. It is for this reason that FinancesOnline, a reputable business directory, has included our charting solution in their list of the top data visualization tools and granted us the Premium Usability Award and the Rising Star Award for 2019!
- Categories: AnyChart Charting Component, News
- No Comments »
JS Sankey Diagram and Other Improvements in AnyChart 8.4.0 Released Just Now
October 8th, 2018 by AnyChart Team The year’s third major update for AnyChart is out, featuring the JS Sankey Diagram chart type as the ultimate centerpiece of the new release.
Learn more about AnyChart 8.4.0 and start making use of our updated JavaScript (HTML5) libraries for interactive data visualization right away.
- Categories: AnyChart Charting Component, AnyGantt, AnyMap, AnyStock, HTML5, JavaScript
- 1 Comment »
JS Chart Libraries Get New Great Features in 8.3.0 Release of AnyChart, AnyStock, AnyMap and AnyGantt
July 10th, 2018 by AnyChart Team We at AnyChart are proud to announce the 8.3.0 release of our JS chart libraries AnyChart, AnyStock, AnyGantt, and AnyMap! The present major update brings full support of HTML in tooltips, background settings for chart data bounds, coloring rules and thresholds, easy axis label positioning, new technical indicators, and even more.
- Categories: AnyChart Charting Component, AnyGantt, AnyMap, AnyStock, Financial Charts, Gantt Chart, HTML5, JavaScript, News, Stock Charts
- 6 Comments »
New Data Visualization Project Examples to Check out – DataViz Weekly
February 23rd, 2018 by AnyChart Team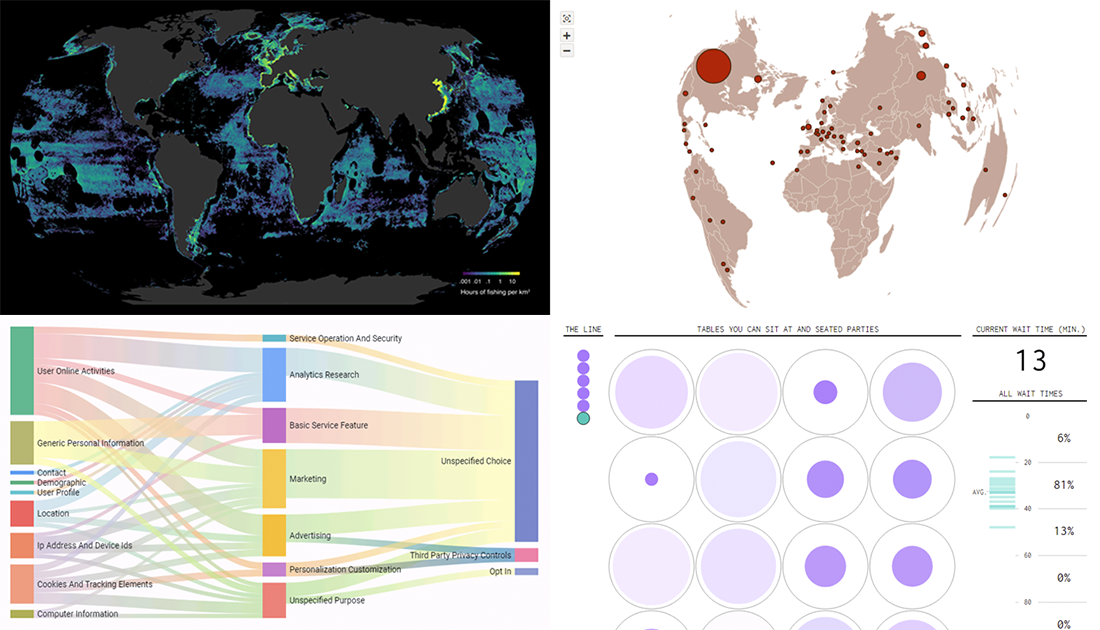 A lot of new charts and infographics on various subjects appear every day, and we are keen to keep sharing some interesting new data visualization project examples in DataViz Weekly. In fact, such things can really serve well for inspiration, to learn more about the world around us or just for fun, which is all good.
Here’s a quick list of what we are glad to spotlight now:
- privacy policies explained through data visualization;
- fishing activities globally;
- waiting for an open table at a restaurant;
- Starbucks restaurant locations worldwide.
- Categories: Data Visualization Weekly
- No Comments »
Happy New Year in JavaScript Charting: AnyChart 8.1.0 Is Out!
December 20th, 2017 by AnyChart Team The New Year and Christmas are already just around the corner, and we have something astonishing for you in this magical time! The next major update for our product family of JavaScript charting libraries is now released, so meet AnyChart 8.1.0!
Check out what new cool and useful features are delivered in the new versions of our HTML5-based interactive data visualization solutions AnyChart, AnyStock, AnyGantt and AnyMap, as well as what we are going to work on next.
- Categories: AnyChart Charting Component, AnyGantt, AnyMap, AnyStock, Financial Charts, Gantt Chart, HTML5, JavaScript, News, Qlik, Stock Charts
- 2 Comments »
Modular JavaScript Charting: AnyChart 8 Premiere
October 2nd, 2017 by AnyChart Team Fall is an amazing time for TV, movie, theater, and other art lovers as that’s when a lot of premieres are being launched. Well, we are happy to contribute to the debut mainstream this time! Meet AnyChart 8, a modular JavaScript charting system taking the convenience, performance, and customization in the art of interactive data visualization to the next level.
Join us in reviewing the core innovations delivered in the 8th, module-based generation of AnyChart, including the brand new features now available in our JS charting libraries AnyChart, AnyStock, AnyGantt, and AnyMap, as well as what else is in our nearest plans.
AnyChart JS Charts 8.0.0: Modules, Custom Builds, and Much More
The 8.0.0 release of the AnyChart, AnyGantt, AnyMap, and AnyStock JavaScript (HTML5) charting libraries delivers a lot of brand new features and technical improvements. Please see the list below for a quick overview of what’s new.
- Categories: AnyChart Charting Component, AnyGantt, AnyMap, AnyStock, Dashboards, Financial Charts, Gantt Chart, HTML5, JavaScript, News, Stock Charts
- 5 Comments »
Data Visualization with JavaScript: The Story of AnyChart JS Charts
September 7th, 2017 by AnyChart Team AnyChart is a flexible JavaScript (HTML5) based solution that allows you to create interactive and great looking charts. It is a cross-browser and cross-platform charting solution intended for everybody who deals with creation of dashboard, reporting, analytics, statistical, financial or any other data visualization solutions. AnyChart works everywhere -PCs, Macs, iPhones, iPads, Android devices and helps businesses transform operational data into actionable information.
Kevin William David interviewed Anton Baranchuk, CEO at AnyChart to know more.
- Categories: AnyChart Charting Component, AnyGantt, AnyMap, AnyStock, Business Intelligence, Flash Platform, GraphicsJS, HTML5, JavaScript, Oracle Apex, Qlik, Success Stories
- No Comments »
AnyChart JavaScript Charting Libraries 7.14.0 Released: Can’t Stop Perfecting Data Visualization!
May 30th, 2017 by AnyChart Team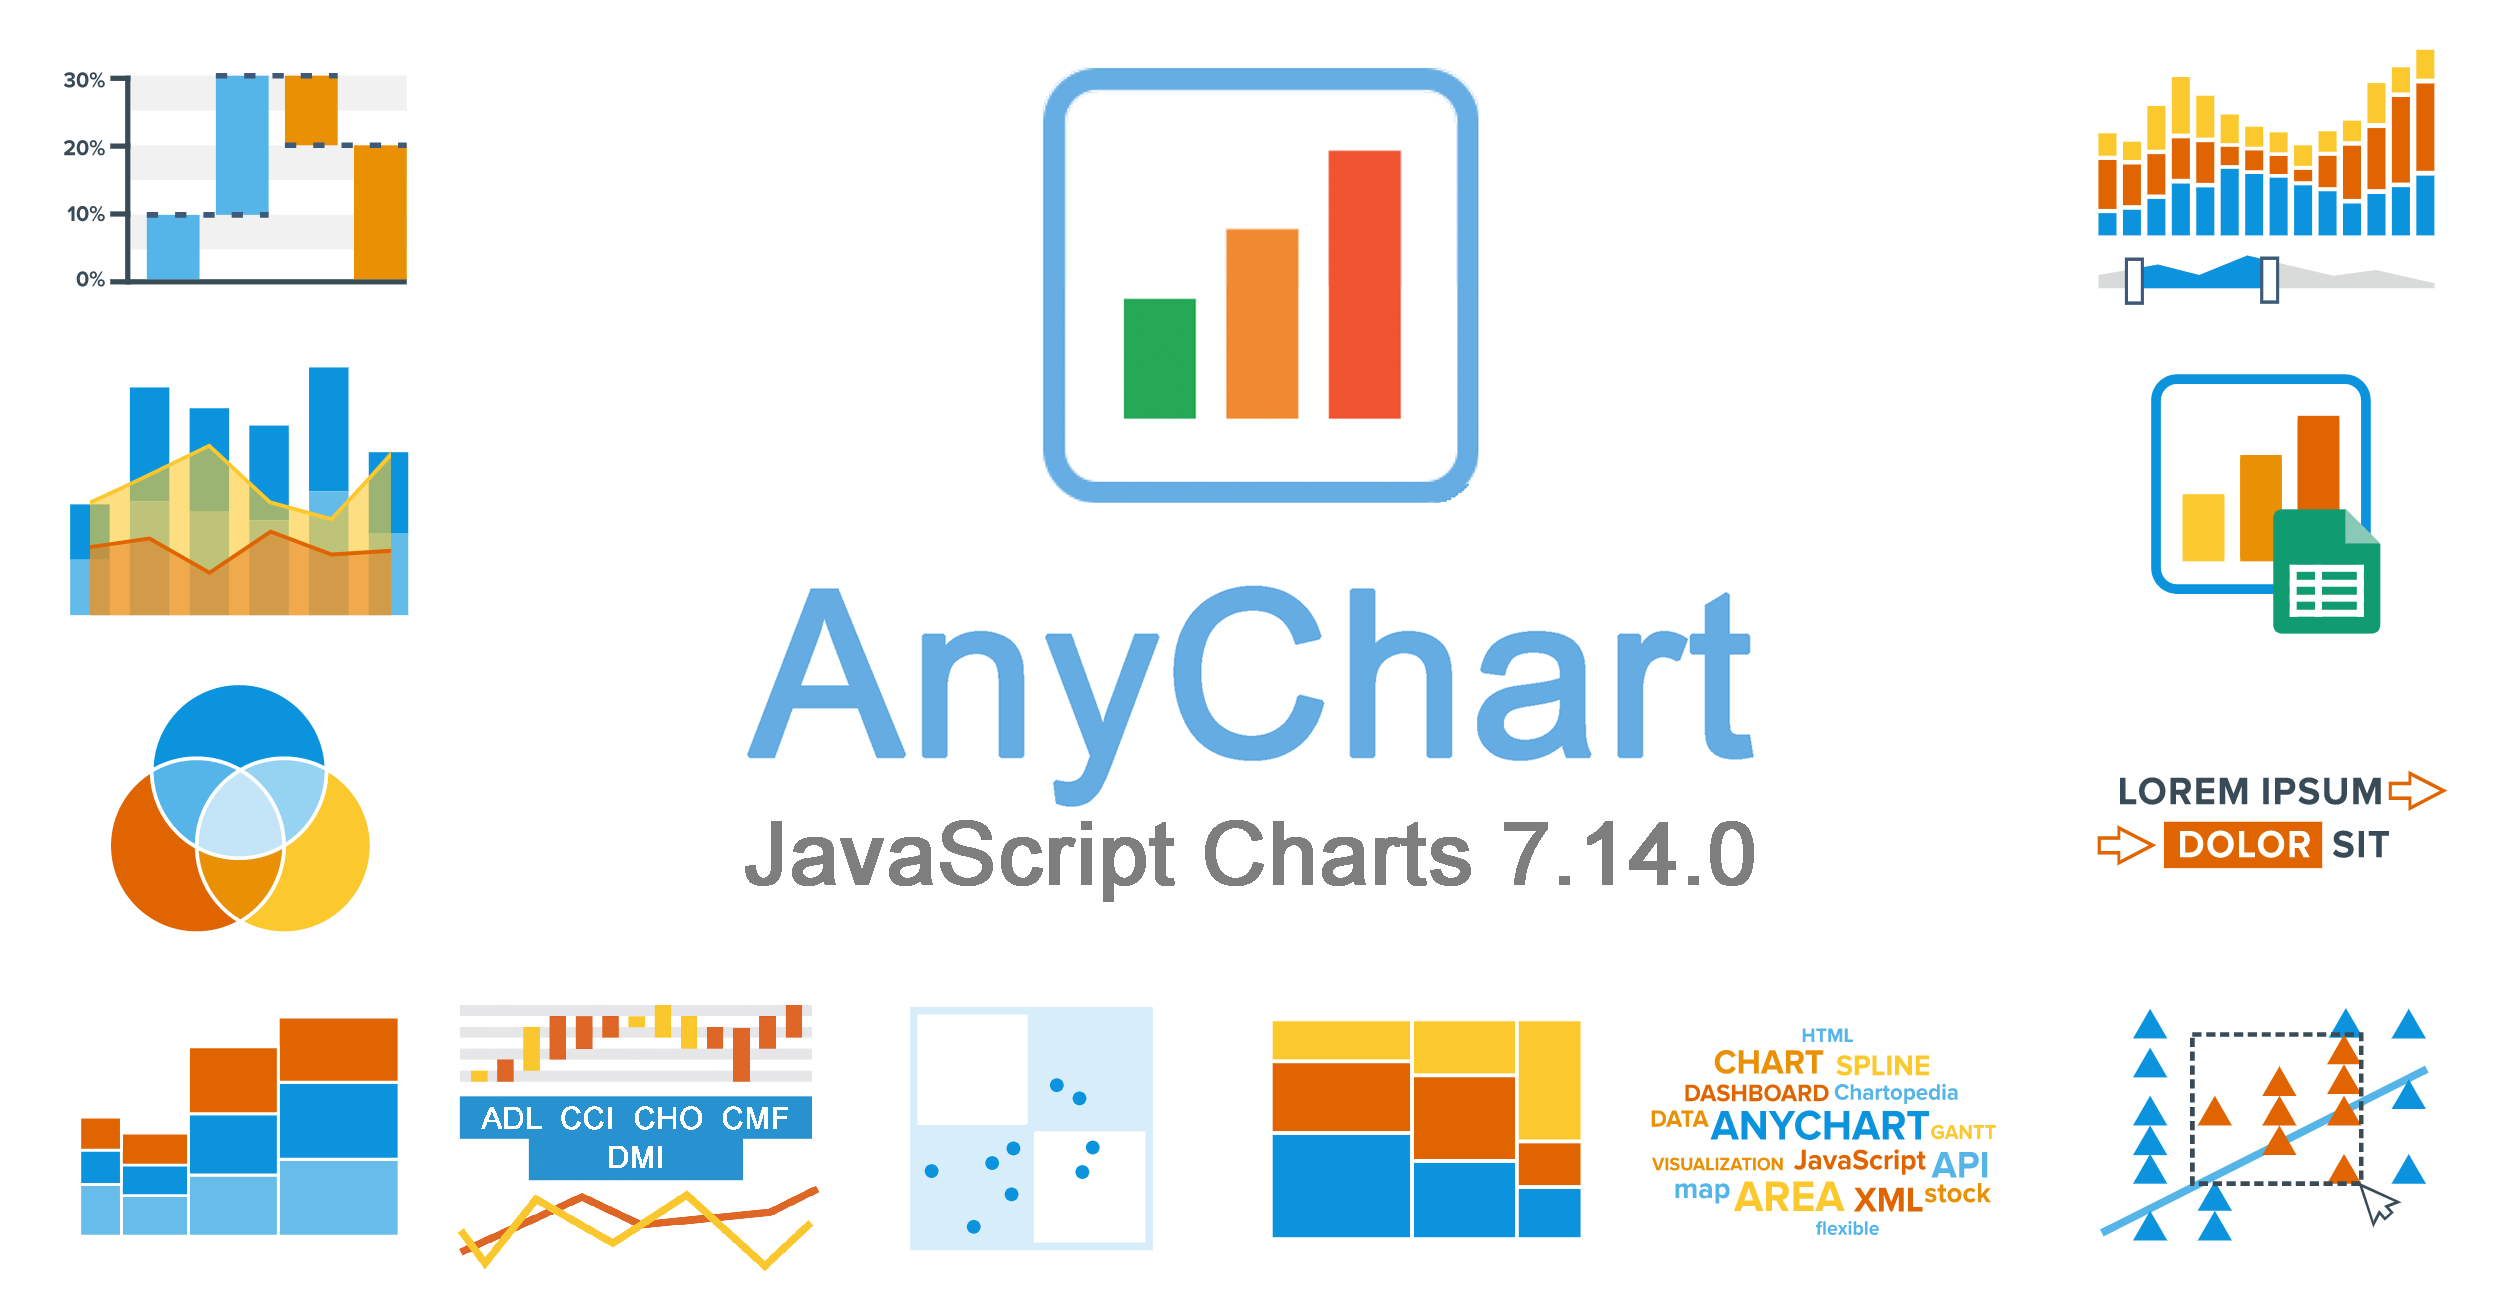 Here are the spring May flowers we promised. After the hard work put in over the past months, we’re happy to announce that the 7.14.0 release of our JavaScript charting libraries AnyChart, AnyStock, AnyMap, and AnyGantt is out and ready to download! It brings you new cool features and important improvements that will make your data visualization life even better.
Now, we invite you to discover all the new JavaScript/HTML5 charting capabilities that the 7.14.0 version of AnyChart’s data visualization software product family has to offer to you. Here’s a quick overview…
- Categories: AnyChart Charting Component, AnyGantt, AnyMap, AnyStock, Business Intelligence, Dashboards, Financial Charts, Gantt Chart, HTML5, JavaScript, News, Stock Charts
- 7 Comments »
JavaScript Charts Library Update 7.13.1 Released for AnyChart, AnyStock, AnyMap, AnyGantt
April 18th, 2017 by AnyChart Team “Sweet April showers do spring May flowers,” once wrote 16th-century English poet Thomas Tusser. Well, our customers already know that AnyChart’s April brings flowers, too! Last year we launched the great 7.10.0 version of the AnyChart JavaScript charts library and, basically, of our whole data visualization product family. Now, in the year of 2017, April brings you another great update.
So, please all greet the 7.13.1 release of AnyChart, AnyMap, AnyStock, and AnyGantt – our cute first spring flowers grown especially for you!
- Categories: AnyChart Charting Component, AnyGantt, AnyMap, AnyStock, HTML5, JavaScript, News, Qlik
- 2 Comments »
Interactive Data Visualization Examples (Mid-April): New Peculiar Charts and Maps in DataViz Weekly
April 14th, 2017 by AnyChart Team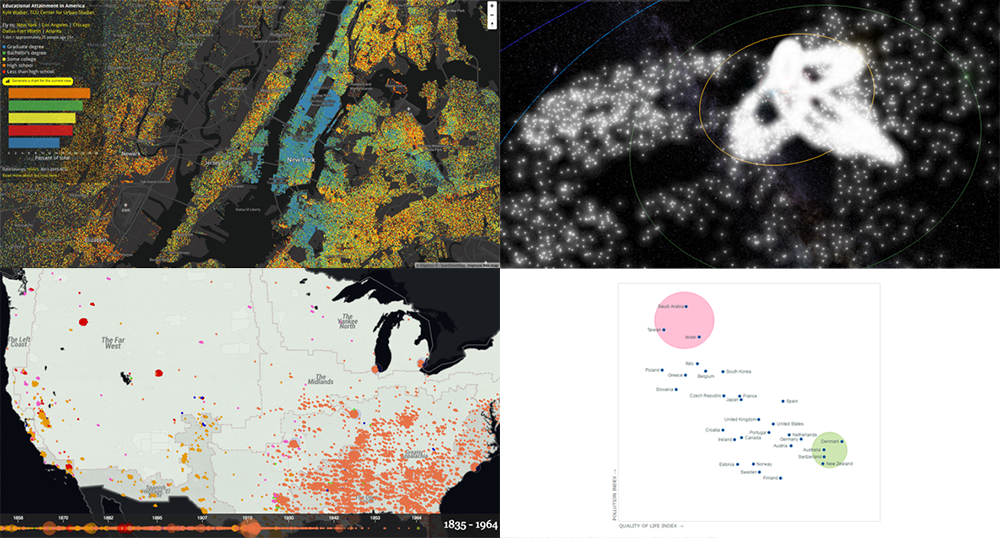 Tired after another workweek? Then now is a great time to lean back and relax and take a quick look at yet another set of interactive data visualization examples! We have shared these visualizations on social networks just recently. They got pretty much attention of our followers (and beyond). So their way to Data Visualization Weekly on the AnyChart blog was quite quick and simple.
Today we are presenting you with interactive visualizations of meteor streams, lynchings in America, JS quadrant chart of top 30 countries by quality of life plotted also according to their pollution indexes, and educational attainment in the United States.
- Categories: Data Visualization Weekly
- No Comments »