SunnyByte Chooses AnyChart for Native American Cancer Data Visualization
February 16th, 2022 by AnyChart Team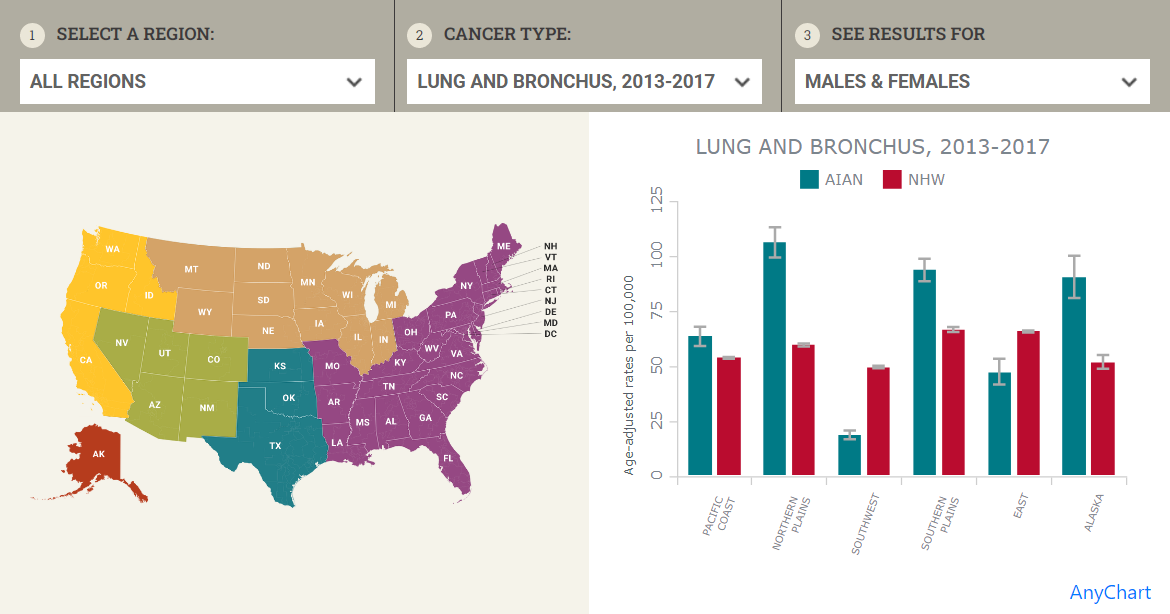 Out-of-the-box error bars and the ability to create a cool error chart without hassle have always been a major attraction of AnyChart, among other great features prompting developers to choose our JavaScript charting library. If you want to look at some real-world examples of such visualizations in action, Shen DeShayne, a partner at SunnyByte has recently brought a new interesting use case for them to our attention. The American Indian & Alaska Native Cancer Data website, his web development agency built for the University of New Mexico, represents information in interactive error charts powered by AnyChart. Learn more about the project and how our JS library is used, from a quick interview. (Stack: Craft CMS/Vue.js.)
- Categories: AnyChart Charting Component, Big Data, HTML5, JavaScript, Success Stories
- No Comments »